Diagrams-as-a-Code DaC with Mingrammer for Public Cloud Providers and Agnostic Stacks.
Abstract
During my analysis of open-source libraries that are suitable for rendering AWS components, in order to simplify the understanding and documenting of application architecture I discovered the Mingrammer Diagrams. What stood out about this library was its approach. In this article, we will explore the usage of DaC (Diagrams-as-Code) and assess its advantages and disadvantages. Mingrammer provides multiple nodes for rendering diagrams. Here is the major list of AWS components which includes icons for popular AWS services like EC2, S3, and RDS, as well as specialized icons for different types of data centers, network architectures, and security models.
The DSL to define nodes and associated mappings between them is very simple, we will go through examples of AWS-related services.
Rendering simple Nodes
Let’s add first simple nodes and group them into the cluster:
1
2
3
4
5
6
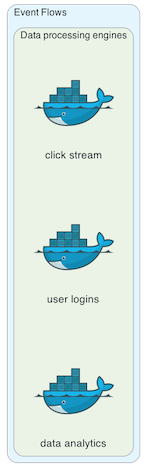
with Cluster("Data processing engines"):
workers = [
Docker("click stream"),
Docker("user logins"),
Docker("data analytics")
]
Mingrammer diagrams are based on the popular Graphviz tool, which is used to create diagrams and visualizations. These diagrams are typically created using a simple text-based language called DOT, which is used to describe the structure and connections between different elements in a diagram.
Mingrammer diagrams build on top of this framework, providing an easier way to create complex diagrams using a variety of different tools and libraries.
Adding AWS nodes
With Mingrammer diagrams, you can easily add annotations, labels, and other visual elements that help to clarify the structure and relationships of different AWS services. This can be especially useful when you are working with complex systems that involve multiple services and components, as it can be difficult to keep track of all of the different pieces without a clear visual representation.
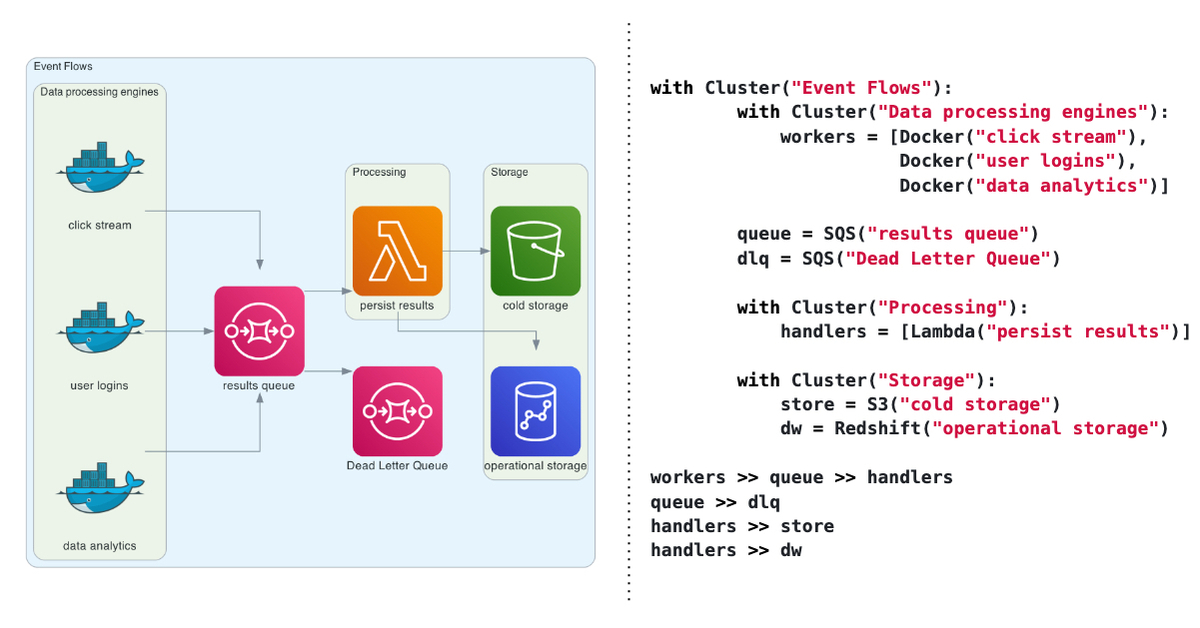
Nodes can be connected with relations by applying » operator: queue >> dlq
1
2
3
4
5
6
7
8
9
10
11
12
13
14
15
16
17
18
19
20
with Cluster("Event Flows"):
        with Cluster("Data processing engines"):
            workers = [Docker("click stream"),
                       Docker("user logins"),
                       Docker("data analytics")]

        queue = SQS("results queue")
        dlq = SQS("Dead Letter Queue")

        with Cluster("Processing"):
            handlers = [Lambda("persist results")]

        with Cluster("Storage"):
            store = S3("cold storage")
            dw = Redshift("operational storage")

workers >> queue >> handlers
queue >> dlq
handlers >> store
handlers >> dw
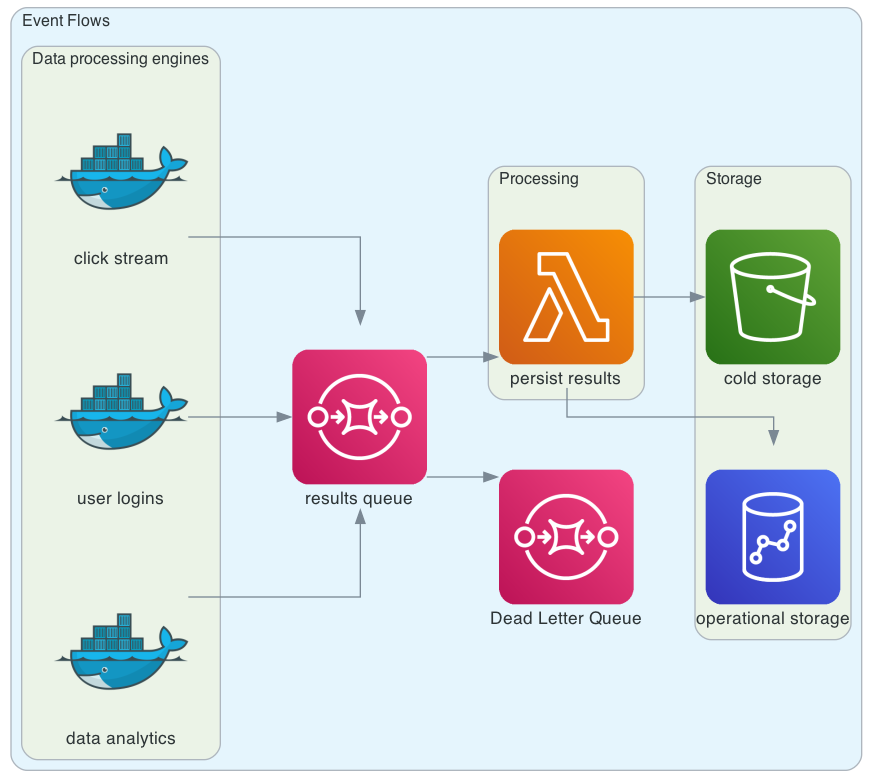 More elements connected with DaC
Adding End-to-End flow
Let’s complete the flow by adding onprem nodes with Logging, Kafka and Spark and also adding style:
1
2
3
4
5
6
7
8
9
10
11
12
13
14
15
16
17
18
19
20
21
22
23
24
25
26
27
28
29
30
31
with Diagram("serverless processing", show=False):

    source = Kafka("Event-Sourcing")

    with Cluster("Event Flows"):
        with Cluster("Data processing engines"):
            workers = [Docker("click stream"),
                       Docker("user logins"),
                       Docker("data analytics")]

        queue = SQS("results queue")
        dlq = SQS("Dead Letter Queue")

        with Cluster("Processing"):
            handlers = [Lambda("persist results")]

        with Cluster("Storage"):
            store = S3("cold storage")
            dw = Redshift("operational storage")

    source >> workers >> queue >> handlers
    queue >> dlq
    handlers >> store
    handlers >> dw

    ingress = Fluentd("logging")
    ingress \
        >> Edge(label="parse") \
        >> source \
        >> Edge(color="black", style="bold") \
        >> Spark()
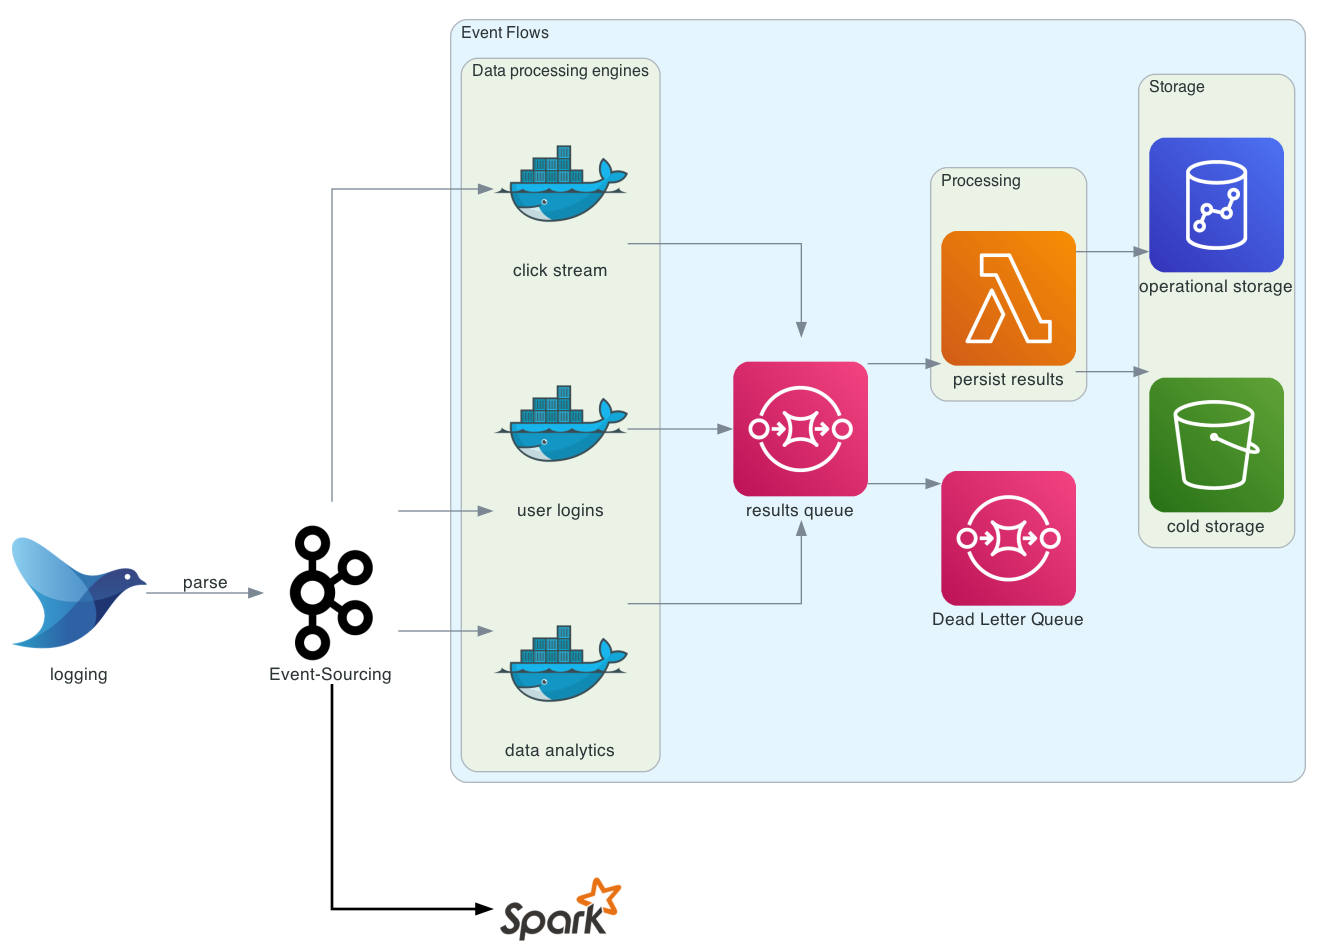 End2End with DaC
Conclusion
The Mingrammer is a user-friendly tool that is easy to set up. Unlike the standard components drawing approach in DRAW.IO, DaC uses an interesting alternative to generate diagrams from code definitions. However, it does not support a vector form and is not compatible with the popular DRAW.IO format.
Let’s summarize some results:
pros:
- with DaC it’s easy to track changes under VCS
- big landscape of predefined nodes including onPrem, all Public Cloud providers service
- supports C4 model
- simple DSL to map nodes
- same library can be used in conjunction with programmatic boto3 or other library to query cloud components and render them
cons:
- low control over location of elements position on the canvas (once more elements added - the location of all elements can be changed/resized/moved to other side of canvas, etc.)
- the result is a raster-graphics image format only
- not a vector format: no possibility to move, align nodes, prettify after generation
- no possibility to export to popular DRAW.IO format for external edition
- no layers
- not possible for offline edition in any editor (result diagram)
- not possible to extract any part of diagram and import to Draw.io or other editors