AWS XRAY tracing. Part 1: Foundational
Abstract
Having used AWS xray for a while now, I can attest to its effectiveness as a tracing and monitoring service. It has saved me a significant amount of time, helped troubleshoot complex issues, and enabled to observe unknown systems with ease. Recently, AWS announced the addition of SNS to SQS integration with path through tracing. Excited to explore this new feature, I decided to verify the integration and write a post about the main features of xray as well. Here are some key highlights:
- almost realtime service map, detailed distributed trace view with metrics
- troubleshooting complex flows and faster more interactive root cause identification
- native integration with other aws managed services out of the box (with service internal details and lifecycles available in the trace)
- end-to-end flow tracing
- additional subsegments injection into trace (specific to you business context/domain)
- enhancing trace with annotations including specific key/value pairs, which can also search as useful parameter for trace search and filtering
- Metadata objects included to trace (raw-based data, dump, etc.)
- Exception and error in trace (detailed error, stracktrace can be included to trace)
- automatic mapping between CloudWatch logs for a specific traceID and flow
- entire full RAW trace data is available for download (in JSON form) to external systems for analysis
- analytics and filtered sampling is supported to define different rates, limit requests, include only specific services
Link to AWS XRAY tracing. Part 2: Advanced: Querying & Grouping
Link to AWS XRAY tracing. Part 3: Sampling & Billing
Introduction
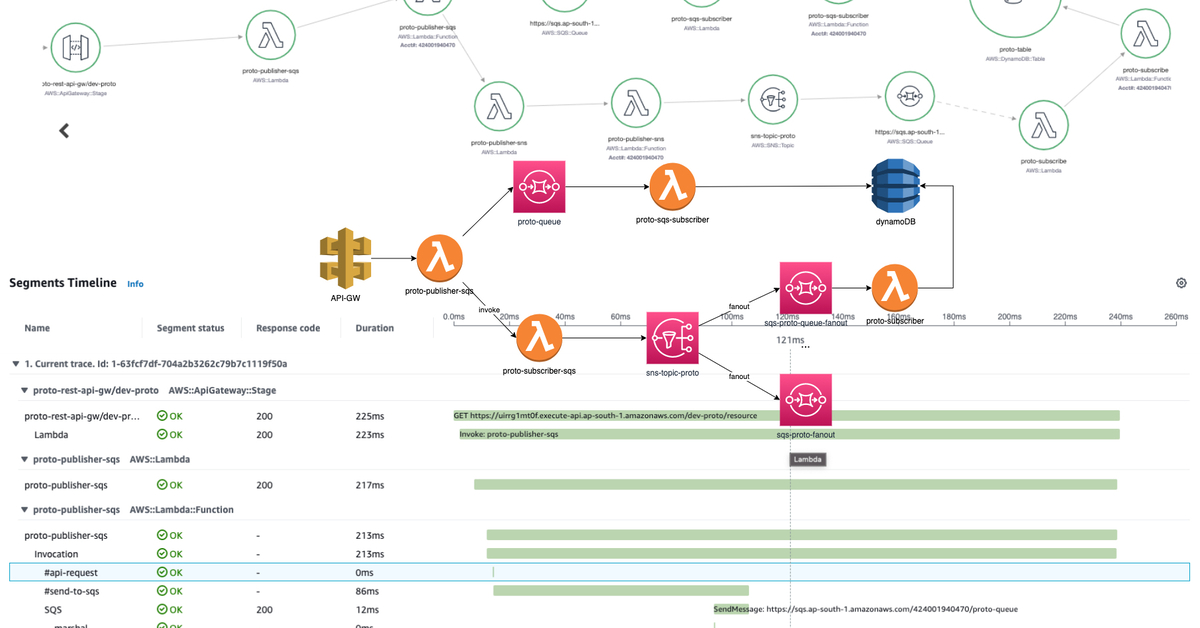
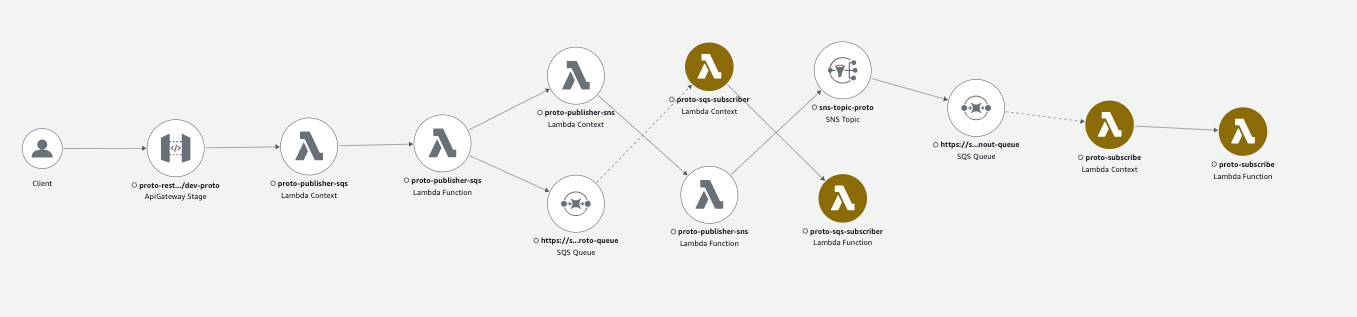
In this post, I have put together a flow that consists of API Gateway, SQS, SNS, DynamoDB, and a group of orchestrating AWS Lambdas: 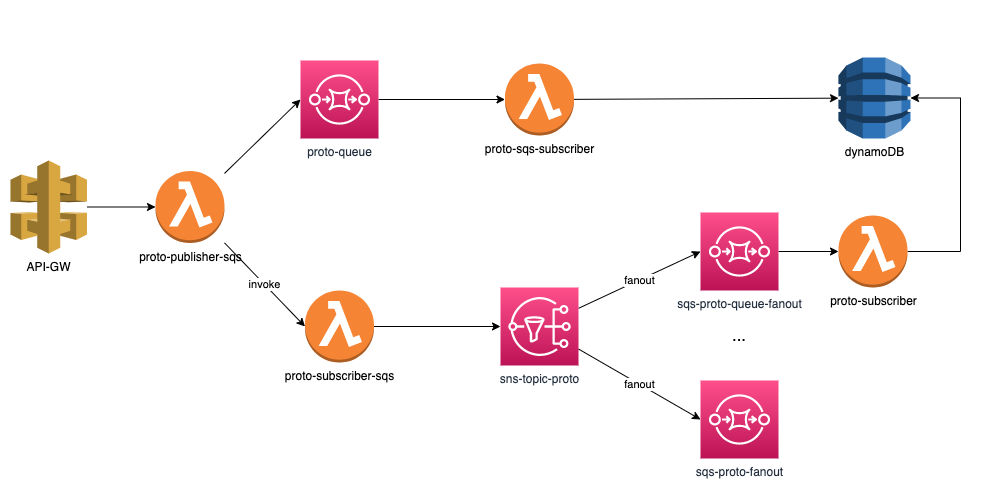 It’s worth noting that while this isn’t a production workload, it serves as a demo setup and does not encompass the full range of xray-supported services.
Tracing in AWS environment
As we are aware, there are various setups for distributed tracing such as Jaeger, Zipkin, and Opentelemetry, which can be incorporated into systems hosted on any environment. These tools are an excellent choice if you are running a cloud-agnostic architecture without managed services and have agreed to tradeoffs where some components in your flow may not be present in your monitoring solutions.
However, if you are fortunate enough to be hosting on AWS, using xray tracing will elevate your monitoring capabilities to a level you may not have experienced before. 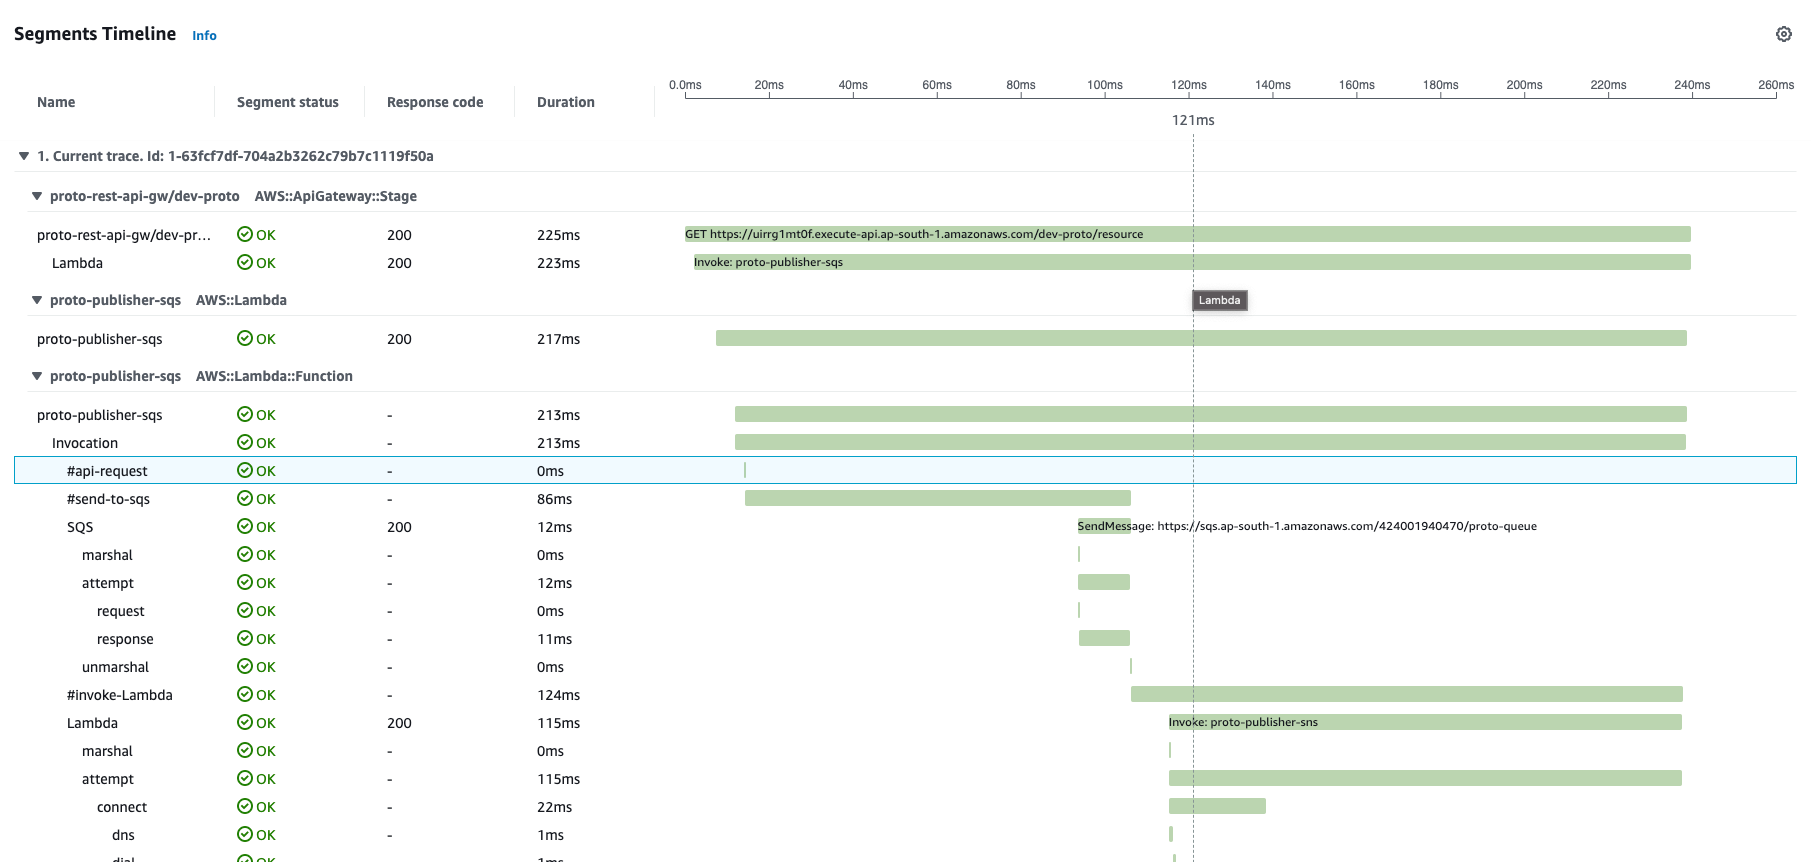
Service map
It is a great starting point to observe entire service mesh, define timeline, choose a specific services that you are interested in for a detailed view. Another option is to view traces that are added to the list based on the timestamp, filter them, and navigate to a dedicated trace.
When observing the service mesh, there are two major views, each of which has control to render service icons or latencies on top, colored health and errors, element with higher invocation rate have bigger scale compared to others.
The initial is xray console: 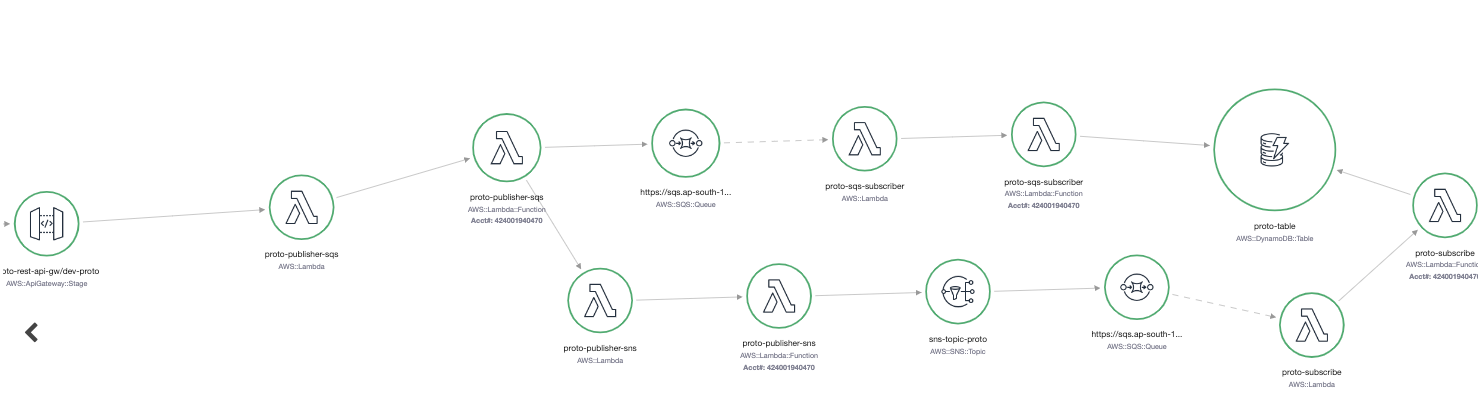 xray in CloudWatch (more preferred):
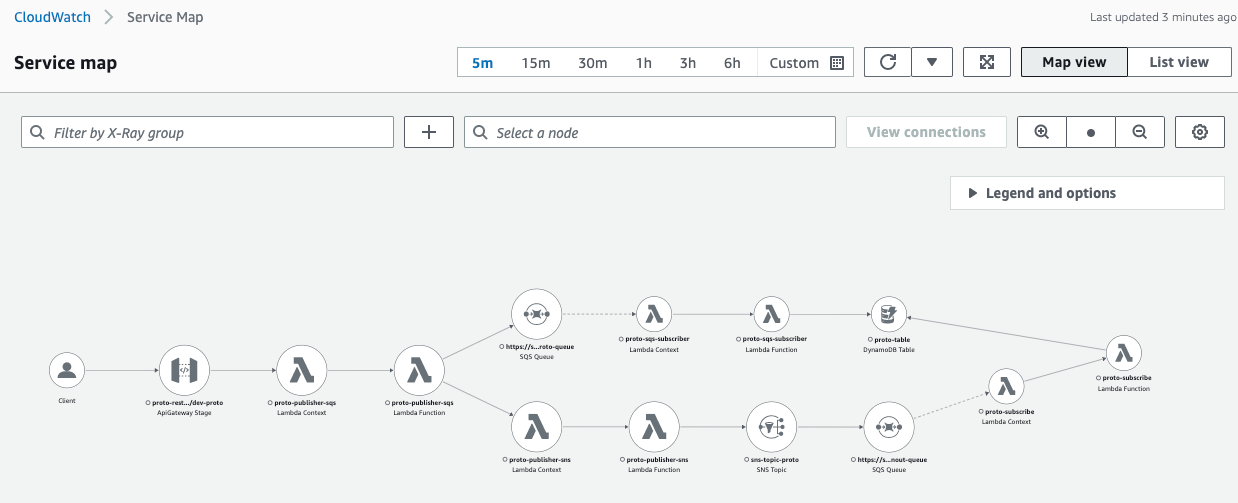
This service map shows only limited amount of element created for Demo, but you will see you entire ecosystem connected with different services. Maybe some connections will surprise you, that you forgot that you are actually using :)
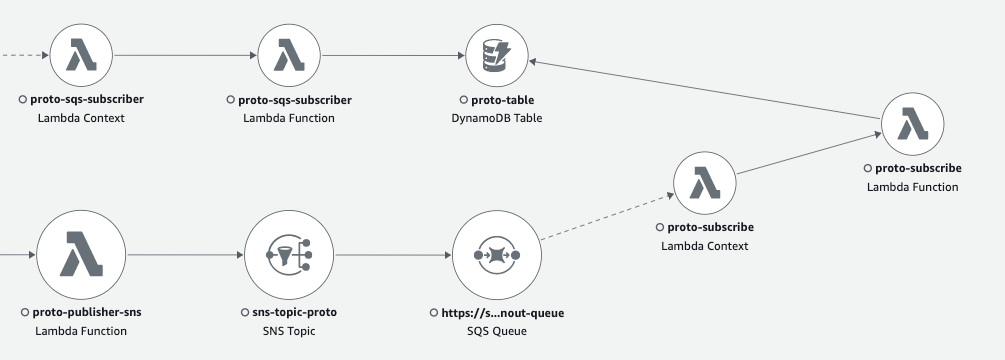
SNS-to-SQS fanout (in the past). 2 orphaned traces. Hack to artificially assemble them into trace chain.
Previously, when using xray with an SNS to SQS fanout component, traceID propagation to the SQS consumer service was not supported, resulting in two different traces that were not connected. This created issues during troubleshooting, as you had to manually maintain and share traceID between producer and consumer chains, and include it as an annotation for lookups if necessary.
In reality, SQS already had meta-information of xray headers, which could identify the parent. However, the SQS receiver AWS SDK always started from creating a new traceID, resulting in our end-to-end traces that interacted through SNS-SQS being rendered and stored as two separate orphaned flows.
To work around this issue, we can read trace details from the SQS message header (already present), and programmatically create a new segment in parallel to the standard segment. If then set the traceID, parentID, and SampleID of the received trace, followed by setting the Origin, ResourceARN, and Region of the trace, the aws xray console rendered such segment as a real Lambda function (with an icon, etc.) and maintained all connections of the end-to-end flow:
1
2
3
4
5
6
7
8
9
10
11
12
13
14
15
16
17
18

if trcHdrStr, ok := sqsEvent.Records[0].Attributes["AWSTraceHeader"]; ok {

  // Hack: extract xray trace from SQS header
  traceHeader := header.FromString(trcHdrStr)
  var seg *xray.Segment
  ctx, seg = xray.BeginSegment(ctx, lambdacontext.FunctionName)
  lc, _ := lambdacontext.FromContext(ctx)

  // Hack: create missing chain to parent trace
  seg.TraceID = traceHeader.TraceID
  seg.ParentID = traceHeader.ParentID
  seg.Sampled = traceHeader.SamplingDecision == header.Sampled

  // Hack: AWS xray console will render this SUBSEGMENT as AWS lambda function you can add any icon - verified :)
  seg.Origin = "AWS::Lambda::Function"
  seg.ResourceARN = lc.InvokedFunctionArn
  seg.GetAWS()["region"] = "us-west-1"
Enjoying xray, I even created an MR for the go-lang SDK to support it 2 years ago https://github.com/aws/aws-xray-sdk-go/pull/322. Of course, that actual changes need to be done in the AWS Lambda service codebase, which is not open-sourced, and we do not have access to contribute and create any MR there.
SNS-to-SQS traceable fanout is now supported out of the box
I’m thrilled to see that it’s now fully implemented and can be used without any workarounds. Just last month (Feb 9, 2023) it was announced that Amazon SNS now supports AWS X-Ray active tracing to visualize, analyze, and debug application performance.
 Event SNS SendMessage operation is trackable in Resources section when SNS-to-SQS fanout is performed
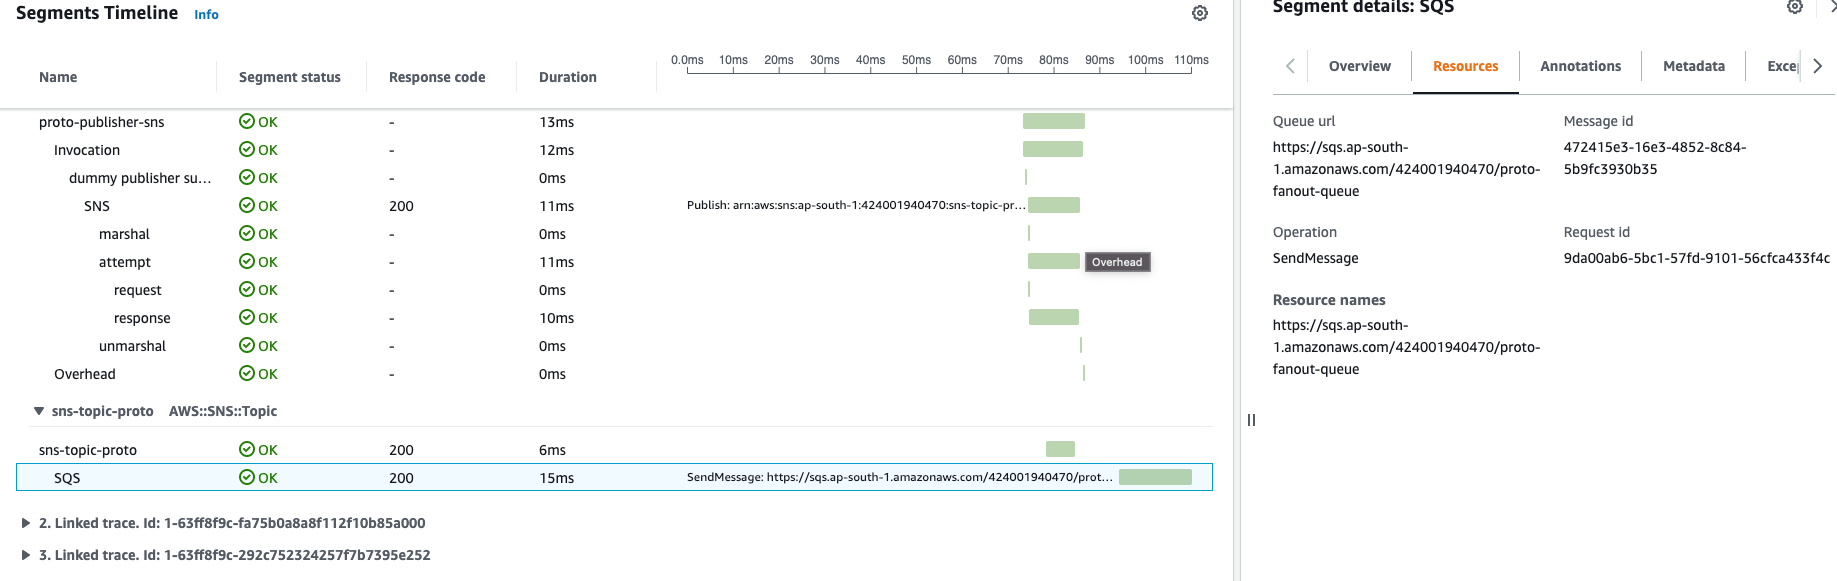
We can even measure timing for SNS to SQS fanout internal operation
We should enable tracing through SNS from AWS Console. In IaC Tracing configuration for SNS as expected can be found in CloudFormation and also now available in Terraform in latest (v4.56) of the AWS provider which was published just 5 days ago.
Traces and integration with Logs based on current trace-id
This is another great feature - by choosing dedicated trace that you are interested in (maybe trace with anomaly latency, performance degradation, unexpected error, etc.) you can also browse CloudWatch logs filtered only for this Event trace. We have single place/dashboard with aggregated control from both logging, monitoring and tracing. 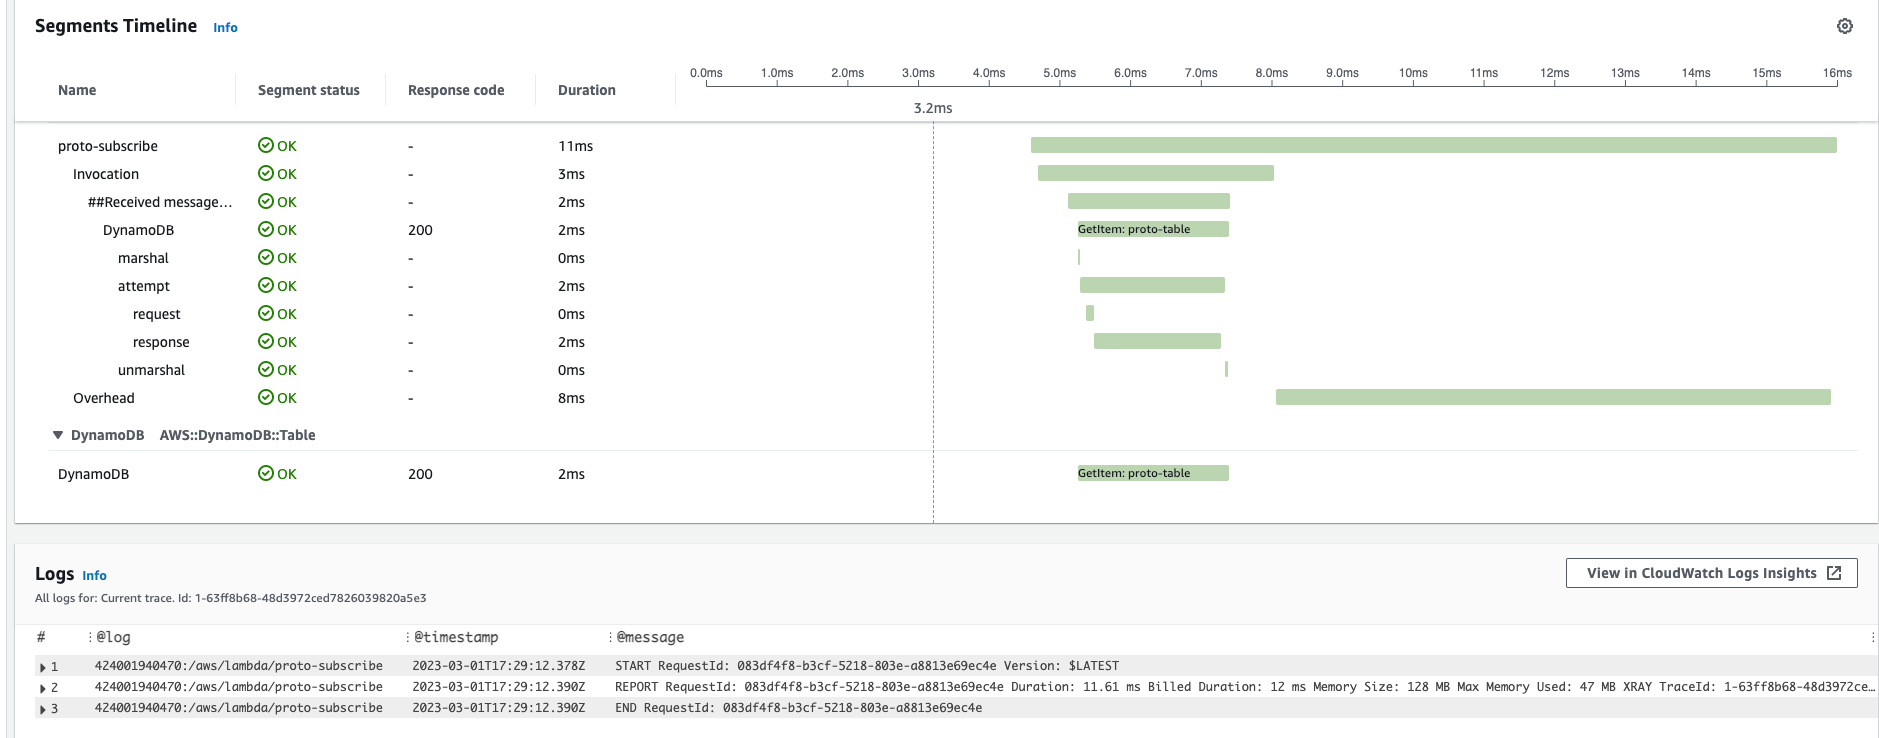
Traces and CloudWatch metrics
For selected element of Service Map we can view actual CloudWatch metrics and verify matching of the SLAs: 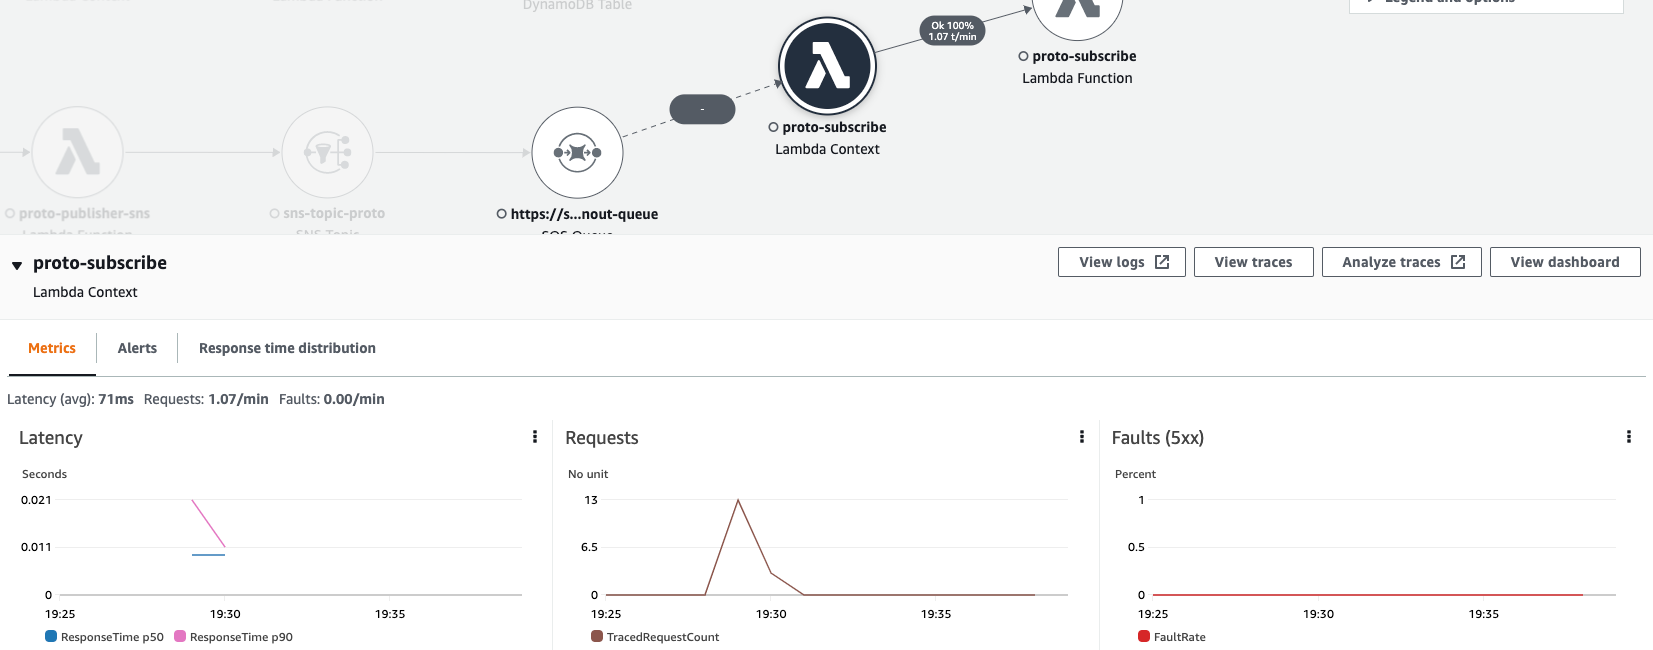
Segments
In detailed trace there are multiple row records - each one is a segment. Each AWS service has its own specific segment details (like lambda invocation, overhead; dynamoDB marshal, attempt, request, response). 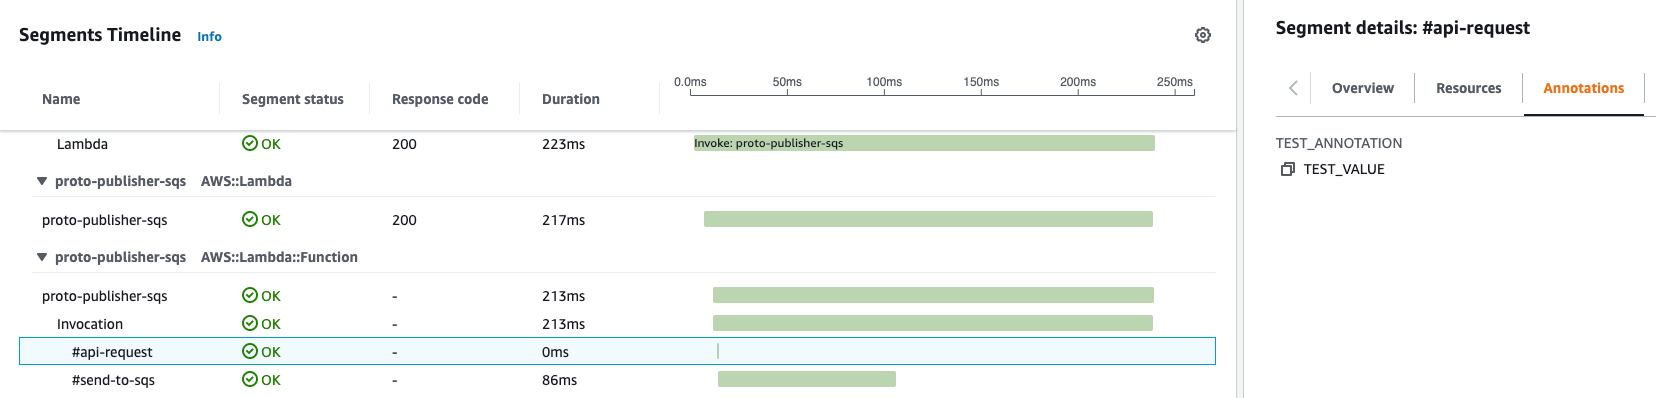
Also, we can add our own custom Segments - these can be some chains of business logic, different executables, invocation of other 3rd parties, etc. Each segment is your visual marker a landmark that should explicitly provide you insight when you are observing distributed tracing. For each Subsegment we can add annotations, metadata.
1
2
3
_, subSegment = xray.BeginSubsegment(ctx, "#api-request")
...
subSegment.Close(nil)
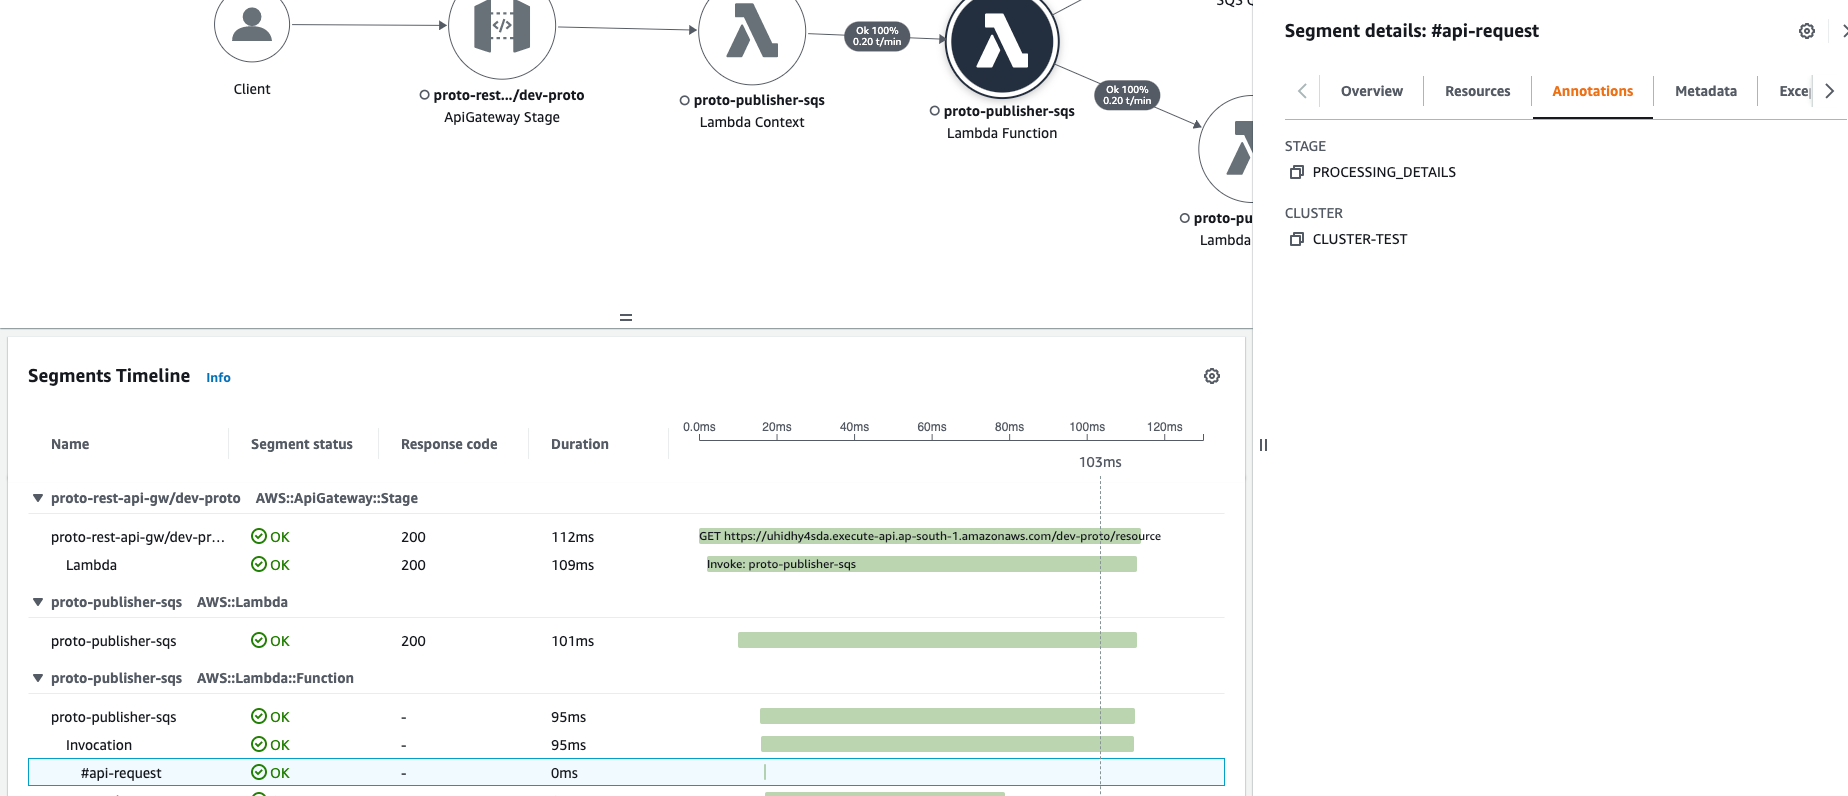
Annotations
Besides logical block with unique naming, Segment supports adding multiple annotations (up to 50 per trace). An annotation is a key-value pair where we can place any specific business values or metrics that are useful for observability and troubleshooting. Xray supports specific DSL to run queries on top traces, and it also supports querying by annotation name and its value, allowing filter only specific traces (for this specific type of data, customer name, command name, etc.)
1
2
subSegment.AddAnnotation("STAGE", "PROCESSING_DETAILS")
subSegment.AddAnnotation("CLUSTER", CLUSTER_ID)
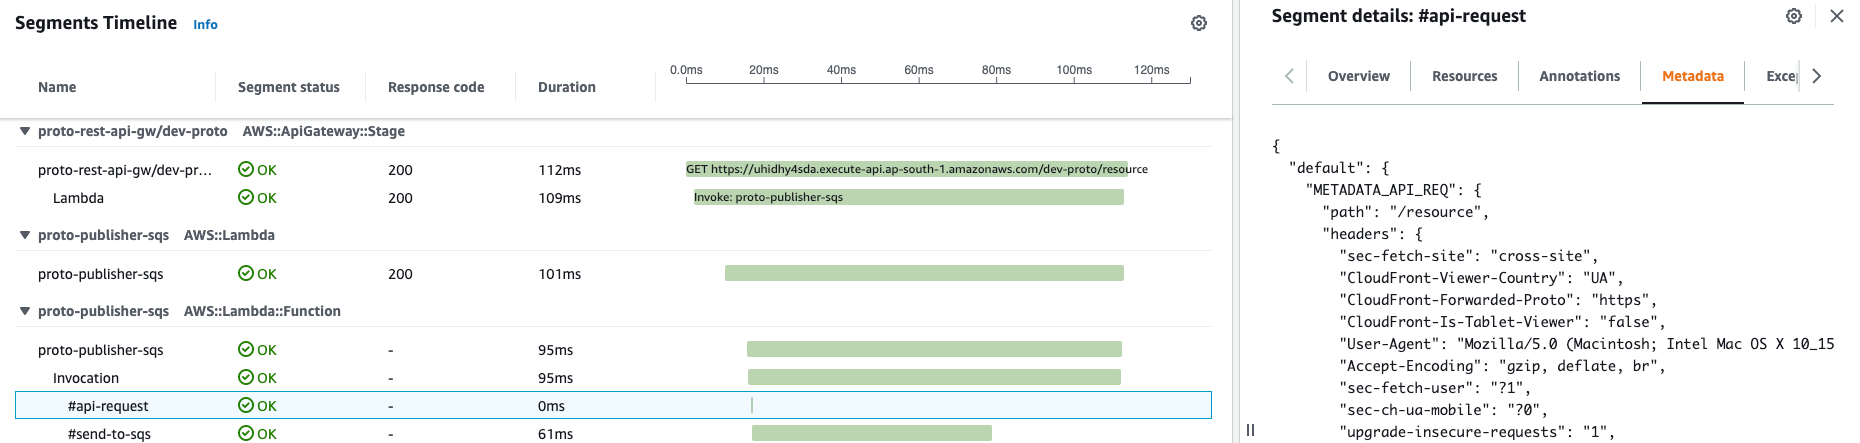
Metadata
Metadata is a special placeholder where you can place some dump, raw data. This is extremely useful when you troubleshoot specific trace and by switching to Metadata you can see initial raw object that was a trigger for this service, or any in/out payload. Based on that and other info it allows to limit the possible troubleshooting scenarios.
No need to perform lookups into additional system of record - OpenSearch or Cloudwatch, using metadata and annotations you can set up what should be available to you later when troubleshooting - you save time and everything is in one place. Here I’m adding API gateway request dump for demo:
1
subSegment.AddMetadata("METADATA_API_REQ", req)
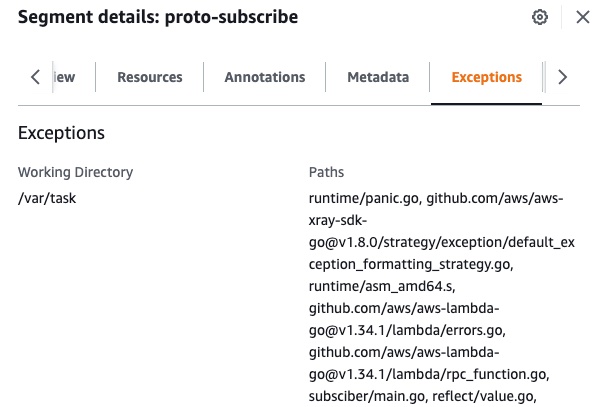
Exceptions
 Components with errors are rendered on Service map with distinct color. And additionally error details are present in Exception tab of segment. Besides standard runtime errors, custom errors can be programmatically added to our segments.
1
2
3
4
5
6
7
...
if err != nil {
  subSegment.AddError(err)
}
...
// Alternative pass error when closing segment
subSegment.Close(err)
Conclusion
It is not feasible to cover such a vast topic in just one post, therefore, I have decided to break it down into a series. In the upcoming parts, we will deep dive into the advanced usage of xray, including custom querying, DSL, analytics, sampling, integrations, and more.
To be continued…