AWS VPC traffic mirroring to IDS. Deep dive with Wireshark.
Abstract
Traffic mirroring refers to the process of copying network traffic from one network port or interface to another for analysis, monitoring, or security purposes. There are multiple options for traffic mirroring depending on what hardware/virtual setup is in use. The most popular modes of interaction with the system during traffic inspection are:
- IDS (Intrusion Detection System) - This system detects suspicious network behavior and generates alerts or notifications if any rules are violated, such as unexpected source/port/protocol. The rules are declared in predefined format (we will check the popular Suricata-based format of rules).
- IPS (Intrusion Prevention System) - This system goes a step further than IDS and not only detects and alerts about suspicious behavior, but also has the capability to influence the traffic, such as dropping packets or changing values.
AWS offers multiple options to achieve these and probably the top is a managed AWS Network Firewall service that operates as an IPS allowing for traffic inspection and application of different rules. This solution is built on the open-source Suricata system. Also, there is option with Transient Gateway and Centralized Egress Appliance VPC but here you should be careful in setup not to have asymmetric traffic drops. Since 2020 newly introduced AWS Gateway Load Balancer can cover IPS scenario.
Here, we will take a look at option with VPC traffic mirroring to check how it works and what happens with packets.
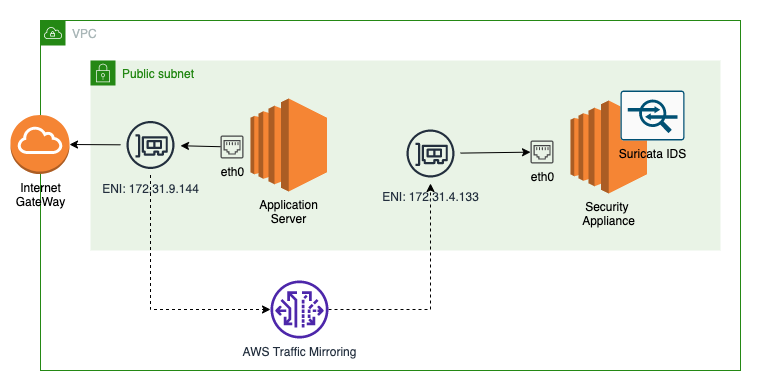
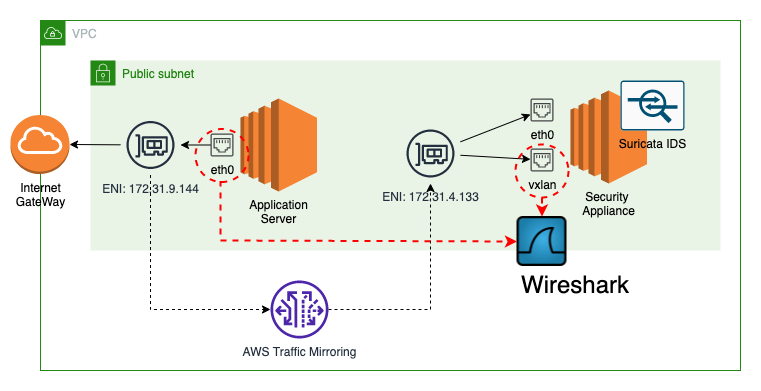
Network setup for traffic mirroring
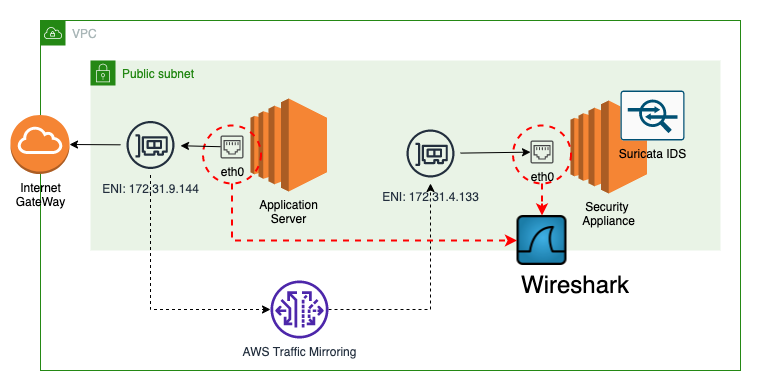
In current setup we will configure VPC traffic mirroring and will use Suricata to inspect packets. You can use any other IDS/IPS - personally I more like Snort, but for this setup Suricata will be used.
To make it easy compared captured packets we will apply filter on top of traffic mirroring session to mirror only incoming and outgoing IMCP ping packets.
To start traffic flow on the source origin instance, we will run ping command to one of Google’s public IPs.
1
ping 142.251.42.79
Configuring VPC traffic mirroring
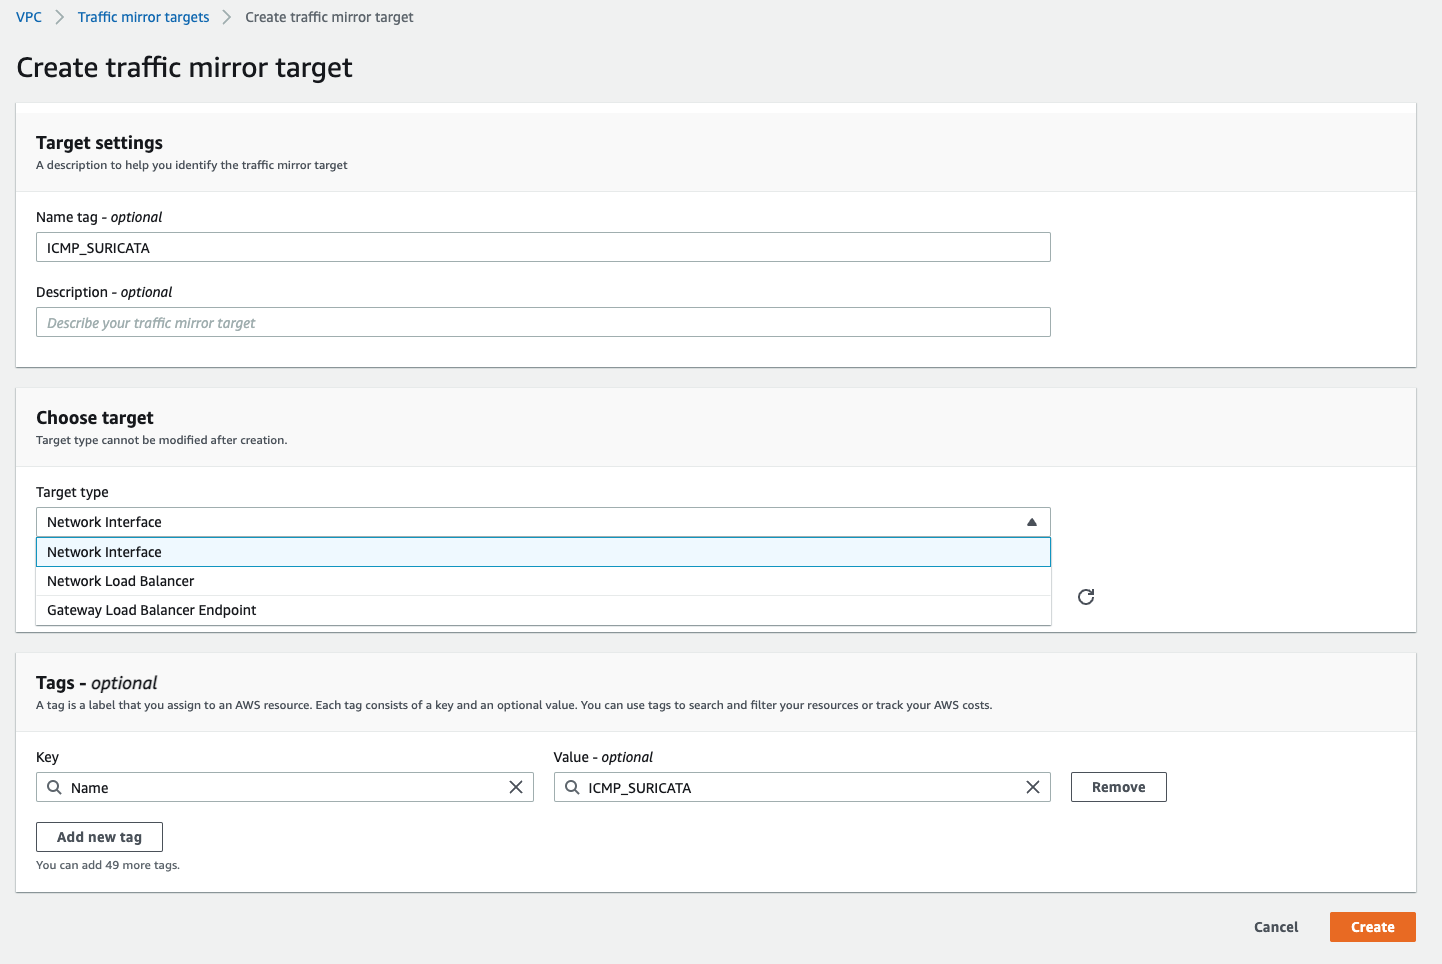
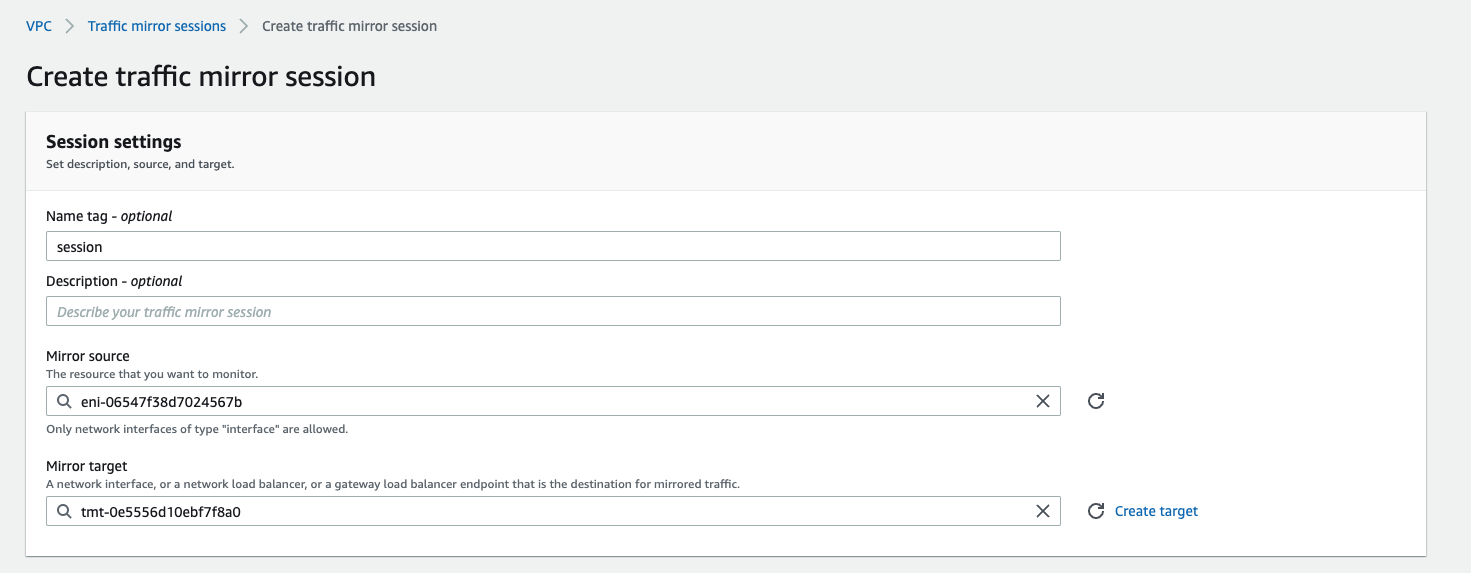
If you are from Cisco world, the setup process is very similar to configuring port span on equipment. We need to follow step of mapping the target - this can be ENI, NLB or Gateway LB endpoint:
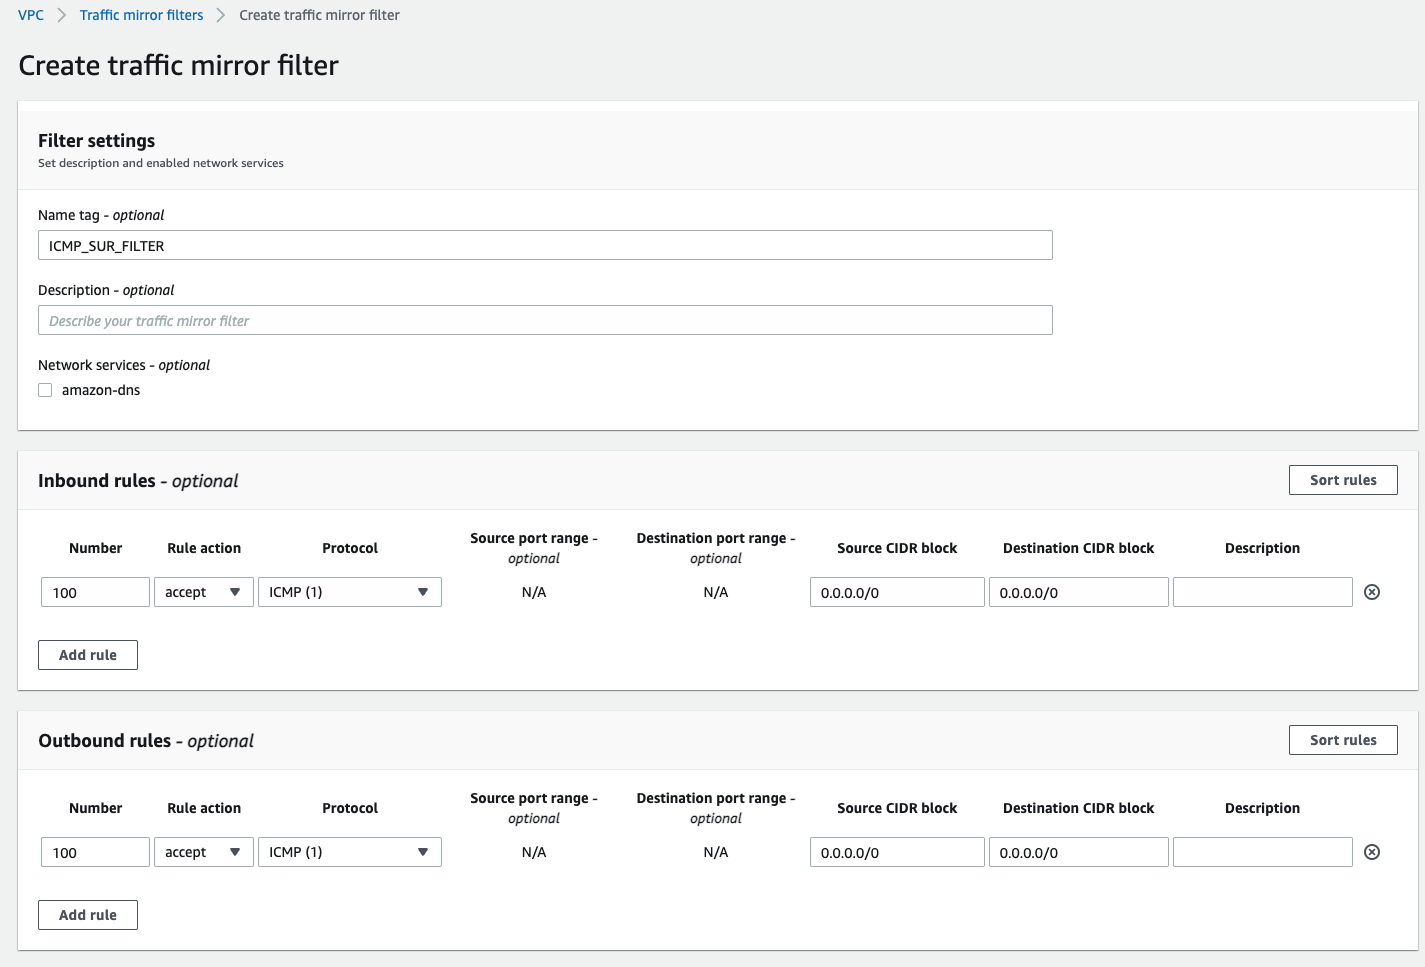
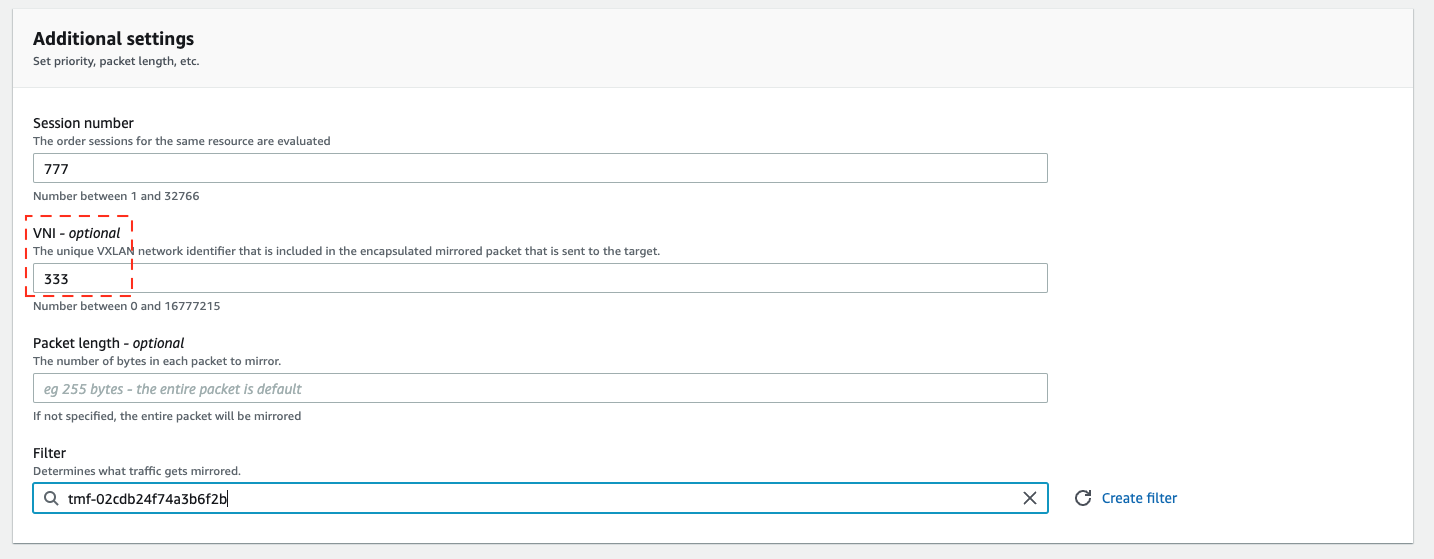
We have control over Inbound and Outbound Rules in traffic filter. If you are interested in specific data traffic that can be classified by source/destinatio CIDRs and ports, by applying them in these filters you will mirror only traffic that is compatible with filter.
And do not forget to start mirror session. Here we specify the traffic source - the ENI of our application instance, target (previously created) and VNI. If VNI is not specified it will be randomly generated. But here we will explicitly define it with value 333, so later in captured traffic we will track this value.
Suricata installation
Next, lets login into appliance instance, install and configure Suricata. Here we are configuring Suricata rules:
- will alert for ICMP from/to any src/dst with message “ICMP traffic detected”
Later we will check why UDP and 4789 port are used.
1
2
3
4
5
6
7
8
9
10
11
12
13
14
sudo -s
# Install epel-release
amazon-linux-extras install -y epel
# Install suricata
yum install -y suricata
# Create the default suricata rules directory
mkdir /var/lib/suricata/rules
# Add a rule to match all UDP traffic
echo 'alert icmp any any -> any any (msg:"ICMP traffic detected"; sid:200001; rev:1;)' > /var/lib/suricata/rules/suricata.rules
# Start suricata listening on eth0 in daemon mode
suricata -c /etc/suricata/suricata.yaml -k none -i eth0 -D
# Capture logs can be found in /var/log/suricata/fast.log
yum install -y jq
tail -f /var/log/suricata/eve.json  | jq 'select(.event_type=="alert")'
Let’s disable Jumbo-frames for this setup:
1
sudo ip link set dev eth0 mtu 1500
NW interfaces on application server
1
2
3
4
5
6
7
8
eth0: flags=4163<UP,BROADCAST,RUNNING,MULTICAST>  mtu 1500
        inet 172.31.9.144  netmask 255.255.240.0  broadcast 172.31.15.255
        inet6 fe80::8d3:93ff:fee4:27b2  prefixlen 64  scopeid 0x20<link>
        ether 0a:d3:93:e4:27:b2  txqueuelen 1000  (Ethernet)
        RX packets 67739  bytes 91125253 (86.9 MiB)
        RX errors 0  dropped 0  overruns 0  frame 0
        TX packets 8329  bytes 777401 (759.1 KiB)
        TX errors 0  dropped 0 overruns 0  carrier 0  collisions 0
NW interfaces Suricata appliance
1
2
3
4
5
6
7
8
eth0: flags=4163<UP,BROADCAST,RUNNING,MULTICAST>  mtu 1500
        inet 172.31.4.131  netmask 255.255.240.0  broadcast 172.31.15.255
        inet6 fe80::836:d2ff:fefc:942e  prefixlen 64  scopeid 0x20<link>
        ether 0a:36:d2:fc:94:2e  txqueuelen 1000  (Ethernet)
        RX packets 147218  bytes 194694578 (185.6 MiB)
        RX errors 0  dropped 0  overruns 0  frame 0
        TX packets 22560  bytes 2819722 (2.6 MiB)
        TX errors 0  dropped 0 overruns 0  carrier 0  collisions 0
Running a ping from application server
First lets monitor Suricata logs:
1
[root@ip-172-31-4-131 ec2-user]# tail -f /var/log/suricata/fast.log
Running ping from application server to public IP - there are no new records in Suricata log.
But when are trying to directly ping Suricata appliance from Application server we see new entries:
1
2
3
[root@ip-172-31-4-131 ec2-user]# tail -f /var/log/suricata/fast.log
02/08/2023-XX:19:07.005845  [**] [1:200001:1] ICMP traffic detected [**] [Classification: (null)] [Priority: 3] {ICMP} 172.31.9.144:3 -> 172.31.4.131:3
02/08/2023-XX:19:07.006011  [**] [1:200001:1] ICMP traffic detected [**] [Classification: (null)] [Priority: 3] {ICMP} 172.31.4.131:3 -> 172.31.9.144:3
Buy the way, Suricata also supports logging in JSON format, very useful to query using JQ utility, we can see same entries but with more details:
1
2
3
4
5
6
7
8
9
10
11
12
13
14
15
16
17
18
19
20
21
22
23
24
25
26
27
28
29
30
31
32
33
34
35
36
37
38
39
40
41
42
43
44
45
46
47
48
49
50
51
52
53
54
55
tail -f /var/log/suricata/eve.json  | jq 'select(.event_type=="alert")'
{
  "timestamp": "2023-02-08TXX:56:10.323036+0000",
  "flow_id": 1671295421574620,
  "in_iface": "eth0",
  "event_type": "alert",
  "src_ip": "172.31.9.144",
  "dest_ip": "172.31.4.131",
  "proto": "ICMP",
  "icmp_type": 8,
  "icmp_code": 0,
  "alert": {
    "action": "allowed",
    "gid": 1,
    "signature_id": 200001,
    "rev": 1,
    "signature": "ICMP traffic detected",
    "category": "",
    "severity": 3
  },
  "flow": {
    "pkts_toserver": 1,
    "pkts_toclient": 0,
    "bytes_toserver": 98,
    "bytes_toclient": 0,
    "start": "2023-02-08TXX:56:10.323036+0000"
  }
}
{
  "timestamp": "2023-02-08TXX:56:10.323195+0000",
  "flow_id": 1671295421574620,
  "in_iface": "eth0",
  "event_type": "alert",
  "src_ip": "172.31.4.131",
  "dest_ip": "172.31.9.144",
  "proto": "ICMP",
  "icmp_type": 0,
  "icmp_code": 0,
  "alert": {
    "action": "allowed",
    "gid": 1,
    "signature_id": 200001,
    "rev": 1,
    "signature": "ICMP traffic detected",
    "category": "",
    "severity": 3
  },
  "flow": {
    "pkts_toserver": 1,
    "pkts_toclient": 1,
    "bytes_toserver": 98,
    "bytes_toclient": 98,
    "start": "2023-02-08TXX:56:10.323036+0000"
  }
}
Capture and inspect traffic with Wireshark
Now lets capture ENIs of both application and appliance instances and compare them.
This is a capture of ping response from 142.251.42.79 to our 172.31.9.144 Application server.
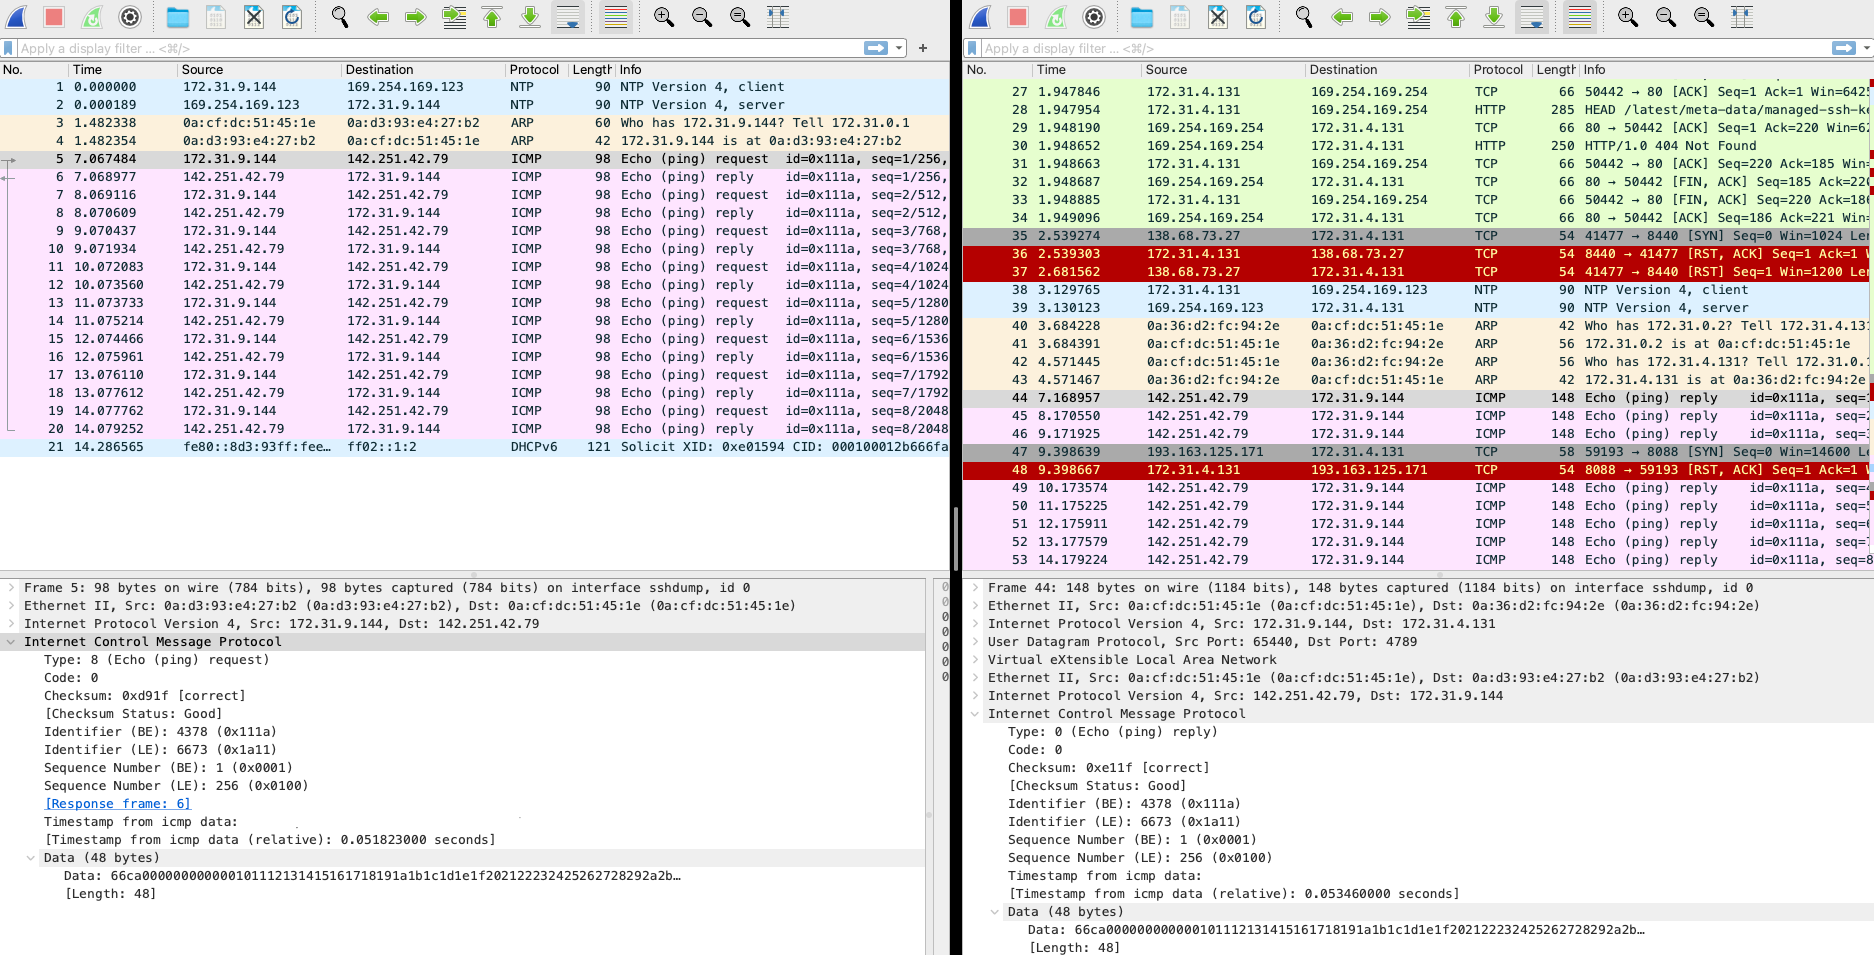
As we can observe, the packets are different. Left side of the screen is a capture of Application server, right - Appliance instance. The initial source ICMP packet is wrapped by VPC traffic mirroring session by UDP packet with additional headers. Here we have capture same ICMP packet sequence number - you can see there is no difference in the inner encapsulated payload.
The outer packet has source of ENI that we are capturing and destination of ENI on target appliance. Also, this is UDP packet sent to 4789 port. That is why initially we did not see any records in log in ICMP ping commands. Also take a look at header VXLAN Network Identifier (VNI) it has value 333 that we have configured previously in session mirror setup.
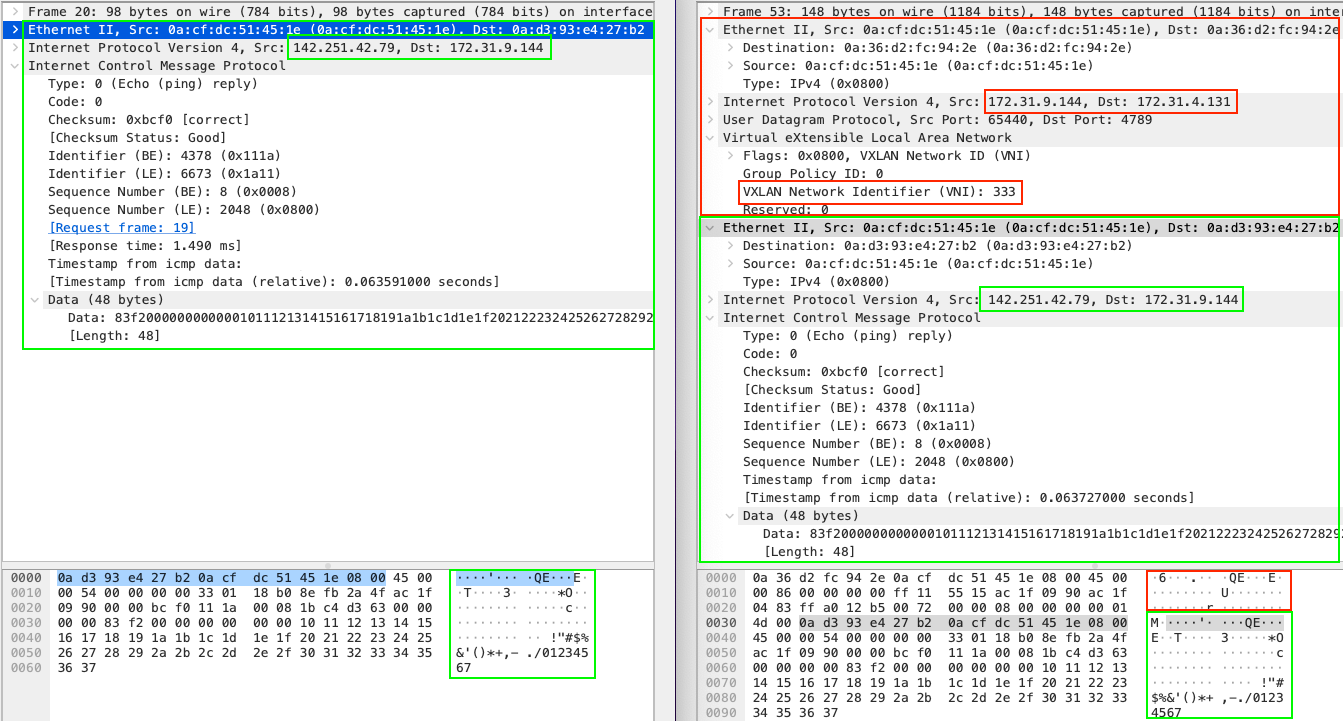
On the right bottom section of the screen you can see how packet encapsulation is applied in a binary form.
UDP traffic mirroring logging:
If we update Suricata with new rule:
1
RULE: alert udp any any -> any 4789 (msg:"UDP Mirror traffic detected"; sid:200001; rev:1;)
Now we can see all mirrored UDP packet incoming into Appliance instance. But with one remark, that these are encapsulated UDP packets and the src/dst are not the same as in origin packet. So it is just for observation, but we can not create and apply any rule for them. We will fix it in a while.
1
2
3
4
5
6
7
8
9
10
11
12
13
14
15
16
17
18
19
20
21
22
23
24
25
26
27
28
29
30

tail -f /var/log/suricata/eve.json  | jq 'select(.event_type=="alert")'
{
  "timestamp": "2023-01-27T13:10:48.181155+0000",
  "flow_id": 1642158420968355,
  "in_iface": "eth0",
  "event_type": "alert",
  "src_ip": "172.31.9.144",
  "src_port": 65511,
  "dest_ip": "172.31.4.131",
  "dest_port": 4789,
  "proto": "UDP",
  "alert": {
    "action": "allowed",
    "gid": 1,
    "signature_id": 200001,
    "rev": 1,
    "signature": "UDP Mirror traffic detected",
    "category": "",
    "severity": 3
  },
  "app_proto": "failed",
  "flow": {
    "pkts_toserver": 1,
    "pkts_toclient": 0,
    "bytes_toserver": 148,
    "bytes_toclient": 0,
    "start": "2023-01-27T13:10:48.181155+0000"
  }
}
This is actually how VXLan works
VXLAN (Virtual Extensible LAN) is a network virtualization technology that uses a VLAN-like encapsulation technique to encapsulate MAC-based OSI Layer 2 Ethernet frames within Layer 3 IP packets. This allows communication between virtualized network segments, providing network isolation and enables the creation of multiple virtual LANs on a single physical infrastructure.

Here’s a summary of how VXLAN works:
- Endpoints (VMs or physical hosts) communicate with each other as if they were on the same LAN, despite being located in different physical locations.
- The VXLAN encapsulation process adds a VXLAN header to the original Ethernet frame, including a 24-bit VXLAN Network Identifier (VNI), which acts as a segment ID for the virtual network.
- The encapsulated frame is then sent as a standard IP packet to the destination endpoint.
- The destination endpoint removes the VXLAN header and processes the original Ethernet frame as if it had never left the local network.
Adding vxlan interface
Usually appliance instance can operate with vxlan traffic and extract encapsulated inner packages. To achieve this - we can add virtual interface on top of eth0 that will perform these actions.
1
2
3

sudo ip link add vxlan100 type vxlan id 333 dstport 4789 local 172.31.4.131 dev eth0
sudo ip link set vxlan100 up
Suricata appliance is now showing second interface:
1
2
3
4
5
6
7
8
9
10
11
12
13
14
15
16
17
ifconfig
eth0: flags=4163<UP,BROADCAST,RUNNING,MULTICAST>  mtu 1500
        inet 172.31.4.131  netmask 255.255.240.0  broadcast 172.31.15.255
        inet6 fe80::836:d2ff:fefc:942e  prefixlen 64  scopeid 0x20<link>
        ether 0a:36:d2:fc:94:2e  txqueuelen 1000  (Ethernet)
        RX packets 147579  bytes 194728353 (185.7 MiB)
        RX errors 0  dropped 0  overruns 0  frame 0
        TX packets 22902  bytes 2910203 (2.7 MiB)
        TX errors 0  dropped 0 overruns 0  carrier 0  collisions 0

vxlan100: flags=4163<UP,BROADCAST,RUNNING,MULTICAST>  mtu 1450
        inet6 fe80::ecb1:f6ff:fe9a:c044  prefixlen 64  scopeid 0x20<link>
        ether ee:b1:f6:9a:c0:44  txqueuelen 1000  (Ethernet)
        RX packets 2  bytes 168 (168.0 B)
        RX errors 0  dropped 0  overruns 0  frame 0
        TX packets 0  bytes 0 (0.0 B)
        TX errors 0  dropped 5 overruns 0  carrier 0  collisions 0
And now if capture Suricata to vxlan100 port - we will see original packet data, src/dst/proto to which we can apply proper rules:
1
2
3
4
5
6
7
8
9
10
11
12
13
14
15
16
17
18
19
20
21
22
23
24
25
26
27
28
29
30
31
32
33
34
35
36
37
38
39
40
41
42
43
44
45
46
47
48
49
50
51
52
53
54
55
56
[root@ip-172-31-4-131 ec2-user]# suricata -c /etc/suricata/suricata.yaml -k none -i vxlan100: -D
[root@ip-172-31-4-131 ec2-user]# tail -f /var/log/suricata/eve.json  | jq 'select(.event_type=="alert")'
{
  "timestamp": "2023-02-08TXX:59:54.986033+0000",
  "flow_id": 650854156340145,
  "in_iface": "vxlan100:",
  "event_type": "alert",
  "src_ip": "172.31.9.144",
  "dest_ip": "142.251.42.79",
  "proto": "ICMP",
  "icmp_type": 8,
  "icmp_code": 0,
  "alert": {
    "action": "allowed",
    "gid": 1,
    "signature_id": 200001,
    "rev": 1,
    "signature": "ICMP traffic detected",
    "category": "",
    "severity": 3
  },
  "flow": {
    "pkts_toserver": 1,
    "pkts_toclient": 0,
    "bytes_toserver": 98,
    "bytes_toclient": 0,
    "start": "2023-02-08TXX:59:54.986033+0000"
  }
}
{
  "timestamp": "2023-02-08TXX:59:54.987442+0000",
  "flow_id": 650854156340145,
  "in_iface": "vxlan100:",
  "event_type": "alert",
  "src_ip": "142.251.42.79",
  "dest_ip": "172.31.9.144",
  "proto": "ICMP",
  "icmp_type": 0,
  "icmp_code": 0,
  "alert": {
    "action": "allowed",
    "gid": 1,
    "signature_id": 200001,
    "rev": 1,
    "signature": "ICMP traffic detected",
    "category": "",
    "severity": 3
  },
  "flow": {
    "pkts_toserver": 1,
    "pkts_toclient": 1,
    "bytes_toserver": 98,
    "bytes_toclient": 98,
    "start": "2023-02-08TXX:59:54.986033+0000"
  }
}
Wireshark capture on vxlan100
Let’s capture traffic again on both instances, but this time on appliance instace we will use vxlan port.
vxlan interface capture (filtered ICMP packets only): 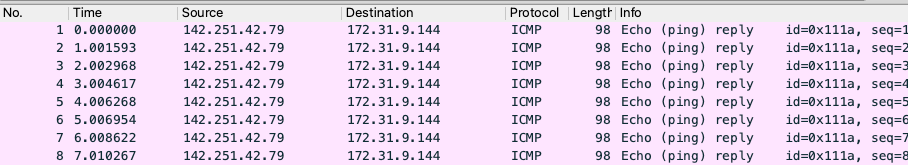
Compare both captures - the data is the same (now there is no encapsulation with UDP, and we can see native raw packets as on the origin). 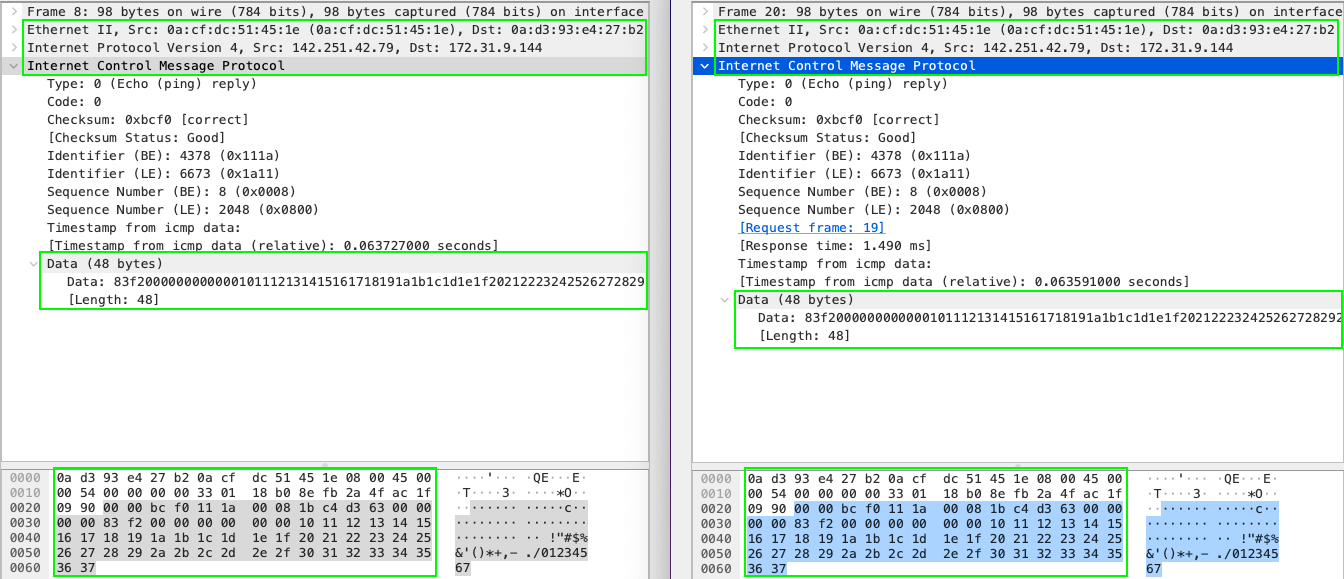
Conclusions
AWS VPC traffic mirroring is a powerful tool that can help improve the security of a network by allowing network administrators to monitor and inspect all incoming and outgoing traffic in real-time. This feature can be particularly useful when used in conjunction with an Intrusion Detection System (IDS) as it provides valuable insights into network activity that can be used to detect and prevent malicious activity.