Detecting objects on image with AWS rekognition and labeling them with OpenCV
Abstract
Amazon Rekognition is a cloud-based image and video analysis service provided by Amazon Web Services (AWS). This powerful service enables developers to incorporate sophisticated computer vision capabilities into their applications without the need for extensive machine learning expertise. Amazon Rekognition makes it easy to analyze and extract valuable information from visual content, ranging from images to videos.
All the code snippets are prepared in a single Jupyter notebook that is shared at Links section.
Key Features:
- Object and Scene Detection
- Facial Analysis and comparison
- Text Detection
- Content Moderation
- Celebrity Recognition
- Custom Labels based on user trained set
Image for analysis
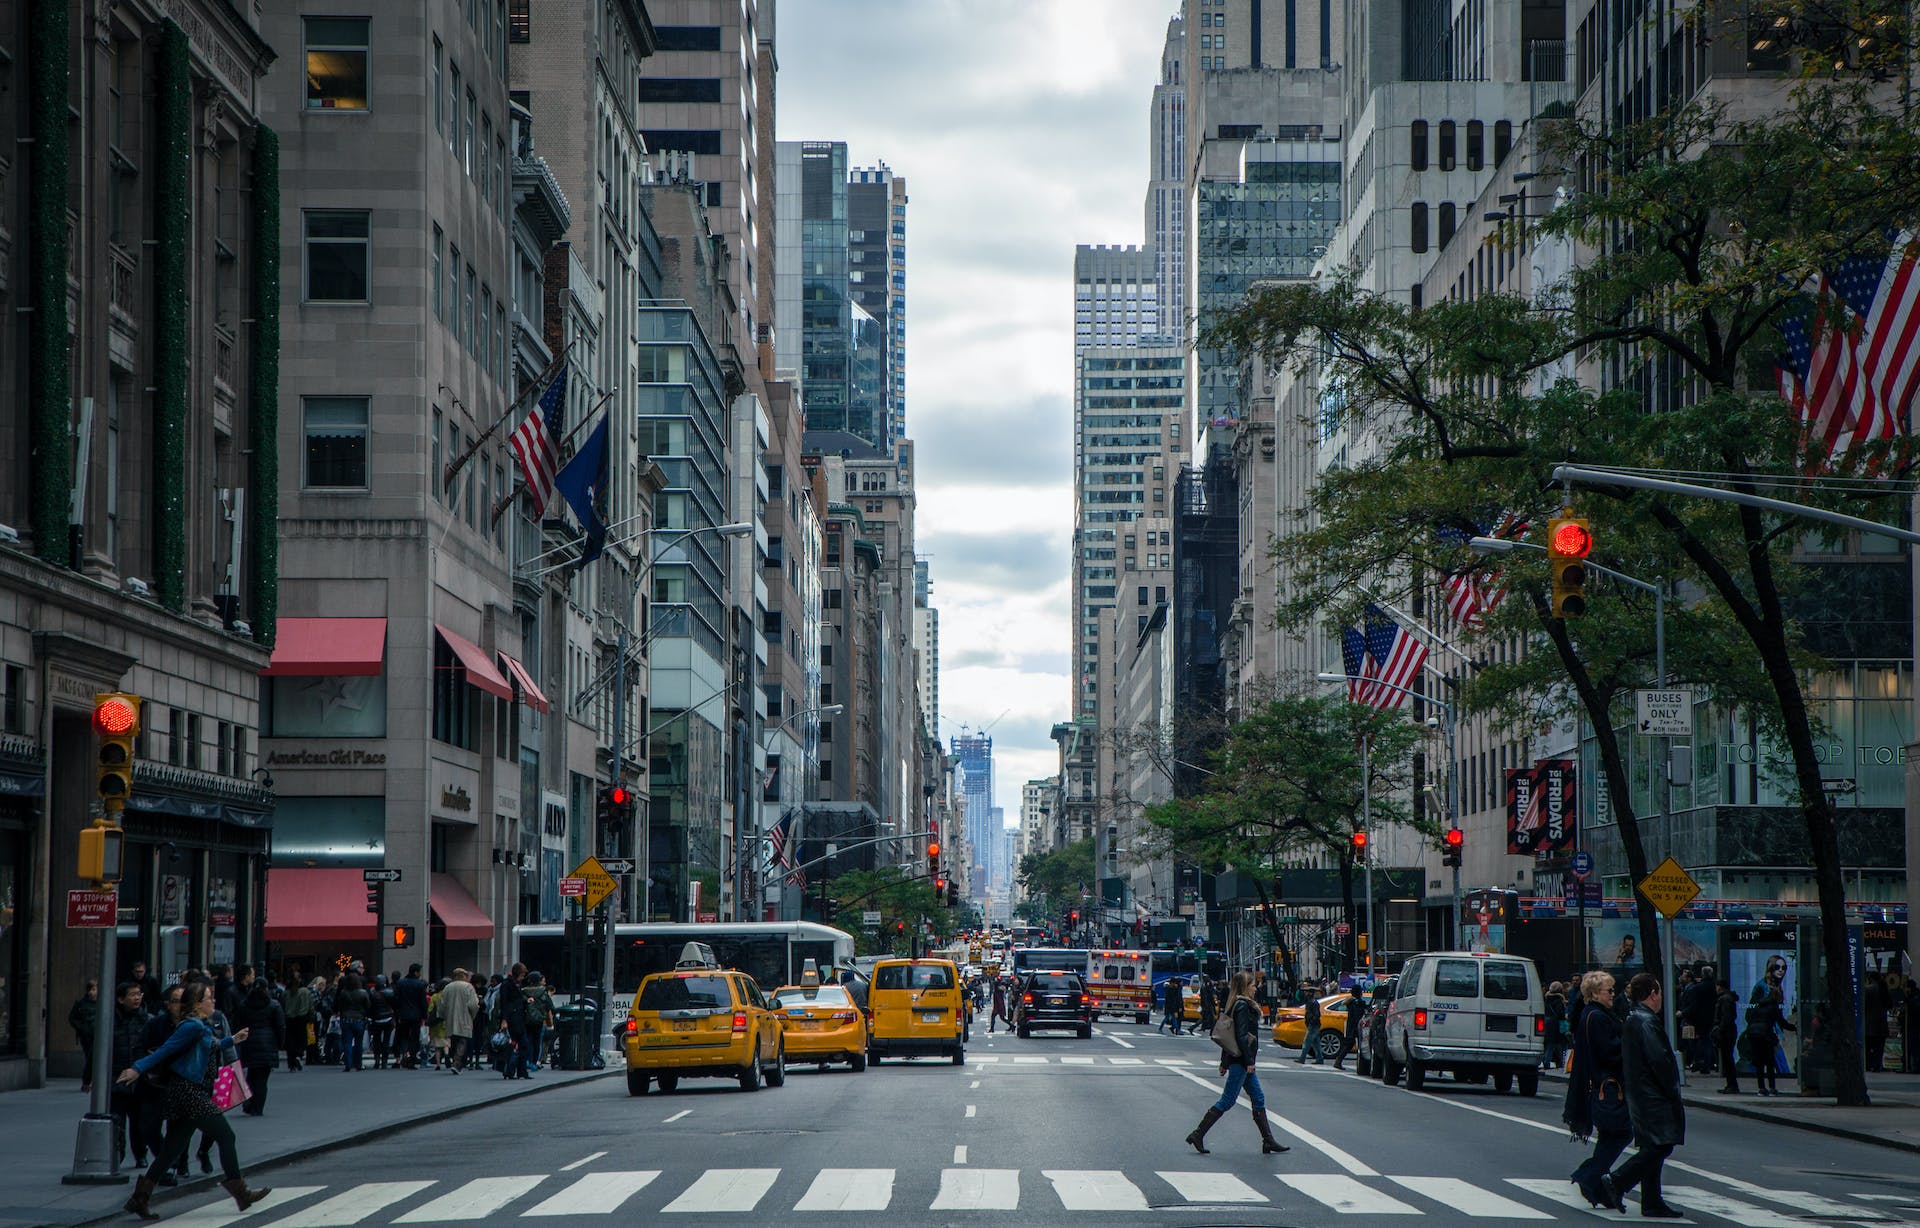
Let’s take random picture of New York street, where multiple object are present - cars, city lights, buildings, pedestrians, etc.
We will use it to perform analysis with aws rekognition.
Uploading the Image
Service supports 2 modes of image uploading, the first case is when the image is in S3, it was uploaded and based on lifecycle rule rekognition logic was triggered - it is the most widely used scenario.
But also there is other option to send image as byte array without storing it in S3 - we will use this option.
1
2
3
4
5
6
7
8
9
10
11
12
13
14
15
16
17
18
19
20
21
22
23
24
rekognition = boto3.client(service_name='rekognition', region_name='us-east-1')

# Read the image file
image_path = 'samp.jpeg'
with open(image_path, 'rb') as image_file:
  image_data = image_file.read()

# Call AWS Rekognition API to detect labels in the image
max_labels = 200
min_confidence = 95
response = rekognition.detect_labels(
  Image={
    'Bytes': image_data
  },
  MaxLabels=max_labels,  # You can adjust this parameter based on your needs
  MinConfidence=min_confidence  # You can adjust this parameter based on your needs
)

print(json.dumps(response, sort_keys=True, indent=4))

# Print detected labels
print("Detected labels:")
for label in response['Labels']:
  print(f"{label['Name']} ({label['Confidence']:.2f}%)")
As a result we can see the following table that gives a basic overview what is represented on the picture. I have aggregated information into the table with category name and probability of this category was on image.
| Category | Probability |
|---|---|
| Building | (99.55%) |
| Cityscape | (99.55%) |
| Light | (99.42%) |
| Traffic Light | (99.42%) |
| Tarmac | (98.98%) |
| Accessories | (97.87%) |
| Bag | (97.87%) |
| Handbag | (97.87%) |
| Person | (97.64%) |
| Car | (95.22%) |
| Transportation | (95.22%) |
| Vehicle | (95.22%) |
Checking the response details
The actual service response contains a lot of metadata, here is a single entity for transport and logistics only, but there are multiple JSON objects in response:
1
2
3
4
5
6
7
8
9
10
11
12
13
14
15
16
17
18
19
20
21
22
23
24
25
26
27
28
29
30
31
32
33
34
35
{
            "Aliases": [],
            "Categories": [
                {
                    "Name": "Transport and Logistics"
                }
            ],
            "Confidence": 99.41839599609375,
            "Instances": [
                {
                    "BoundingBox": {
                        "Height": 0.07998945564031601,
                        "Left": 0.8064739108085632,
                        "Top": 0.4241378605365753,
                        "Width": 0.02277914620935917
                    },
                    "Confidence": 99.41839599609375
                },
                {
                    "BoundingBox": {
                        "Height": 0.03180865943431854,
                        "Left": 0.7512333393096924,
                        "Top": 0.6746096611022949,
                        "Width": 0.010767364874482155
                    },
                    "Confidence": 95.53616333007812
                }
            ],
            "Name": "Traffic Light",
            "Parents": [
                {
                    "Name": "Light"
                }
            ]
        },
The key element here is BoundingBox that has information about the area on source image where this Object was detected. By parsing this response in a loop we can add layer on top of source image with augmented rectangles to show objects that were detected.
Identifies the bounding box around the label, face, text, object of interest, or personal protective equipment. The left (x-coordinate) and top (y-coordinate) are coordinates representing the top and left sides of the bounding box. Note that the upper-left corner of the image is the origin (0,0).
The top and left values returned are ratios of the overall image size. For example, if the input image is 700x200 pixels, and the top-left coordinate of the bounding box is 350x50 pixels, the API returns a left value of 0.5 (350/700) and a top value of 0.25 (50/200).
The bounding box coordinates can have negative values. For example, if Amazon Rekognition is able to detect a face that is at the image edge and is only partially visible, the service can return coordinates that are outside the image bounds and, depending on the image edge, you might get negative values or values greater than 1 for the left or top values.
OpenCV to mark detected objects
1
2
3
4
5
6
7
8
9
10
11
12
13
14
15
16
17
18
19
20
21
22
23
24
25
26
image = cv2.imread('samp.jpeg')

print(image.shape[1])
print(image.shape[0])

for label in response['Labels']:
    if 'Instances' in label:
        red = random.randint(0, 255)
        green = random.randint(0, 255)
        blue = random.randint(0, 255)
        for instance in label['Instances']:

            annotation = instance['BoundingBox']
            width = int(annotation['Width'] * image.shape[1])
            height = int(annotation['Height'] * image.shape[0])
            left = int(annotation['Left'] * image.shape[1])
            top = int(annotation['Top'] * image.shape[0])

            # Draw a rectangle on the image
            cv2.rectangle(image, (left, top), (left + width, top + height), (red, green, blue), 2)
            x =  int((left + width/2))
            y =  int((top + height/2))

            cv2.putText(image, f"{label['Name']}: {round(instance['Confidence'])}%", (x,y), cv2.FONT_HERSHEY_SIMPLEX, 1, (red,green,blue), 2)

cv2.imwrite(f'augmented-{max_labels}_{min_confidence}.png',image)
We are choosing random colors for each group category, adding rectange for each Bounding Box of this group and also add Text with group name:
Image: probability=70%, max_labels=50
When invoking rekognition there are 2 params for tunning:
- max_labels to detect on image
- min_confidence in %
Image: probability=90%, max_labels=50
Previous augmented image had max_labels=50,min_confidence=70. Here is next augmented image with max_labels=50,min_confidence=90. And it changes a little 
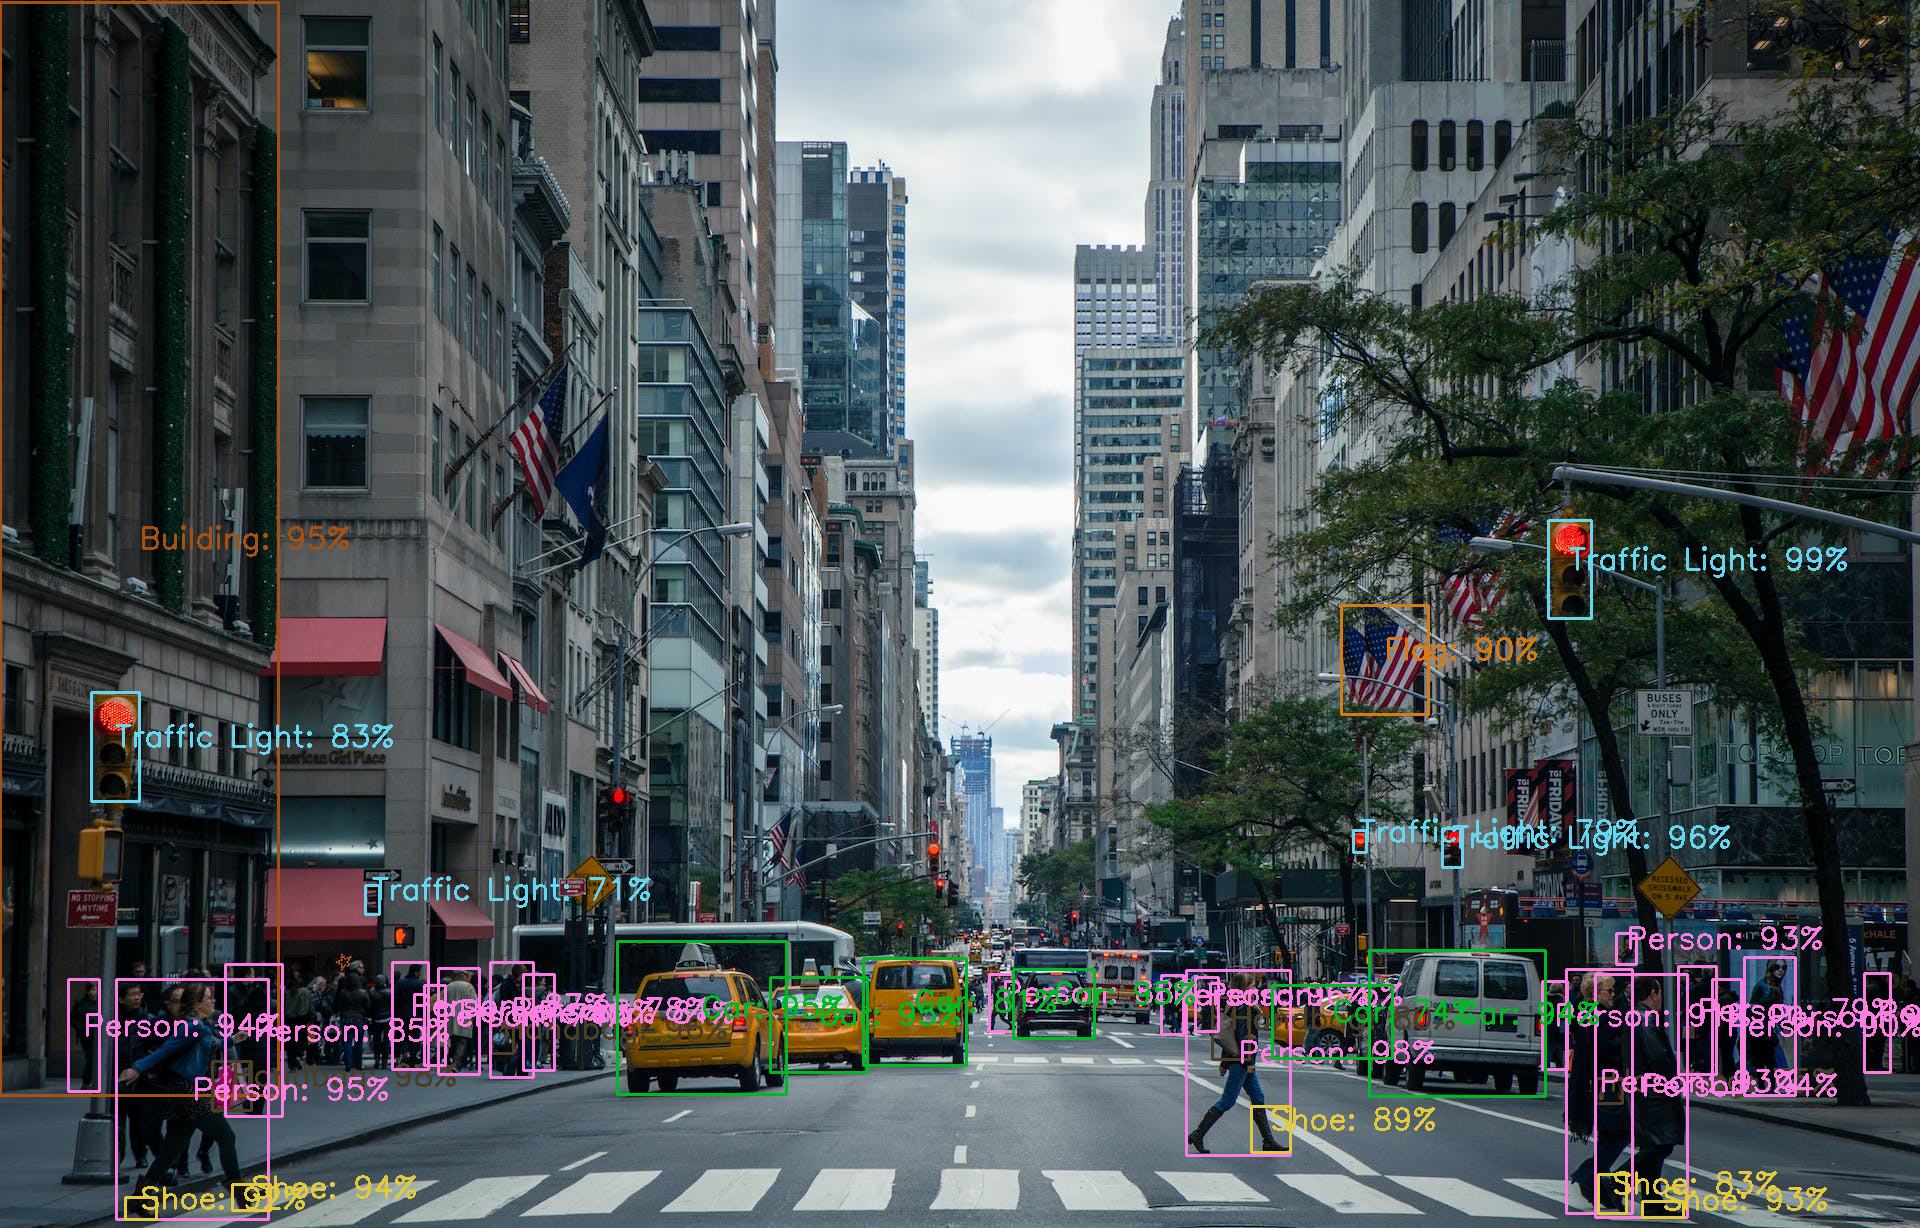
Image: probability=95%, max_labels=200
Same way we can add any additional info, here I’m showing the probability of each label:
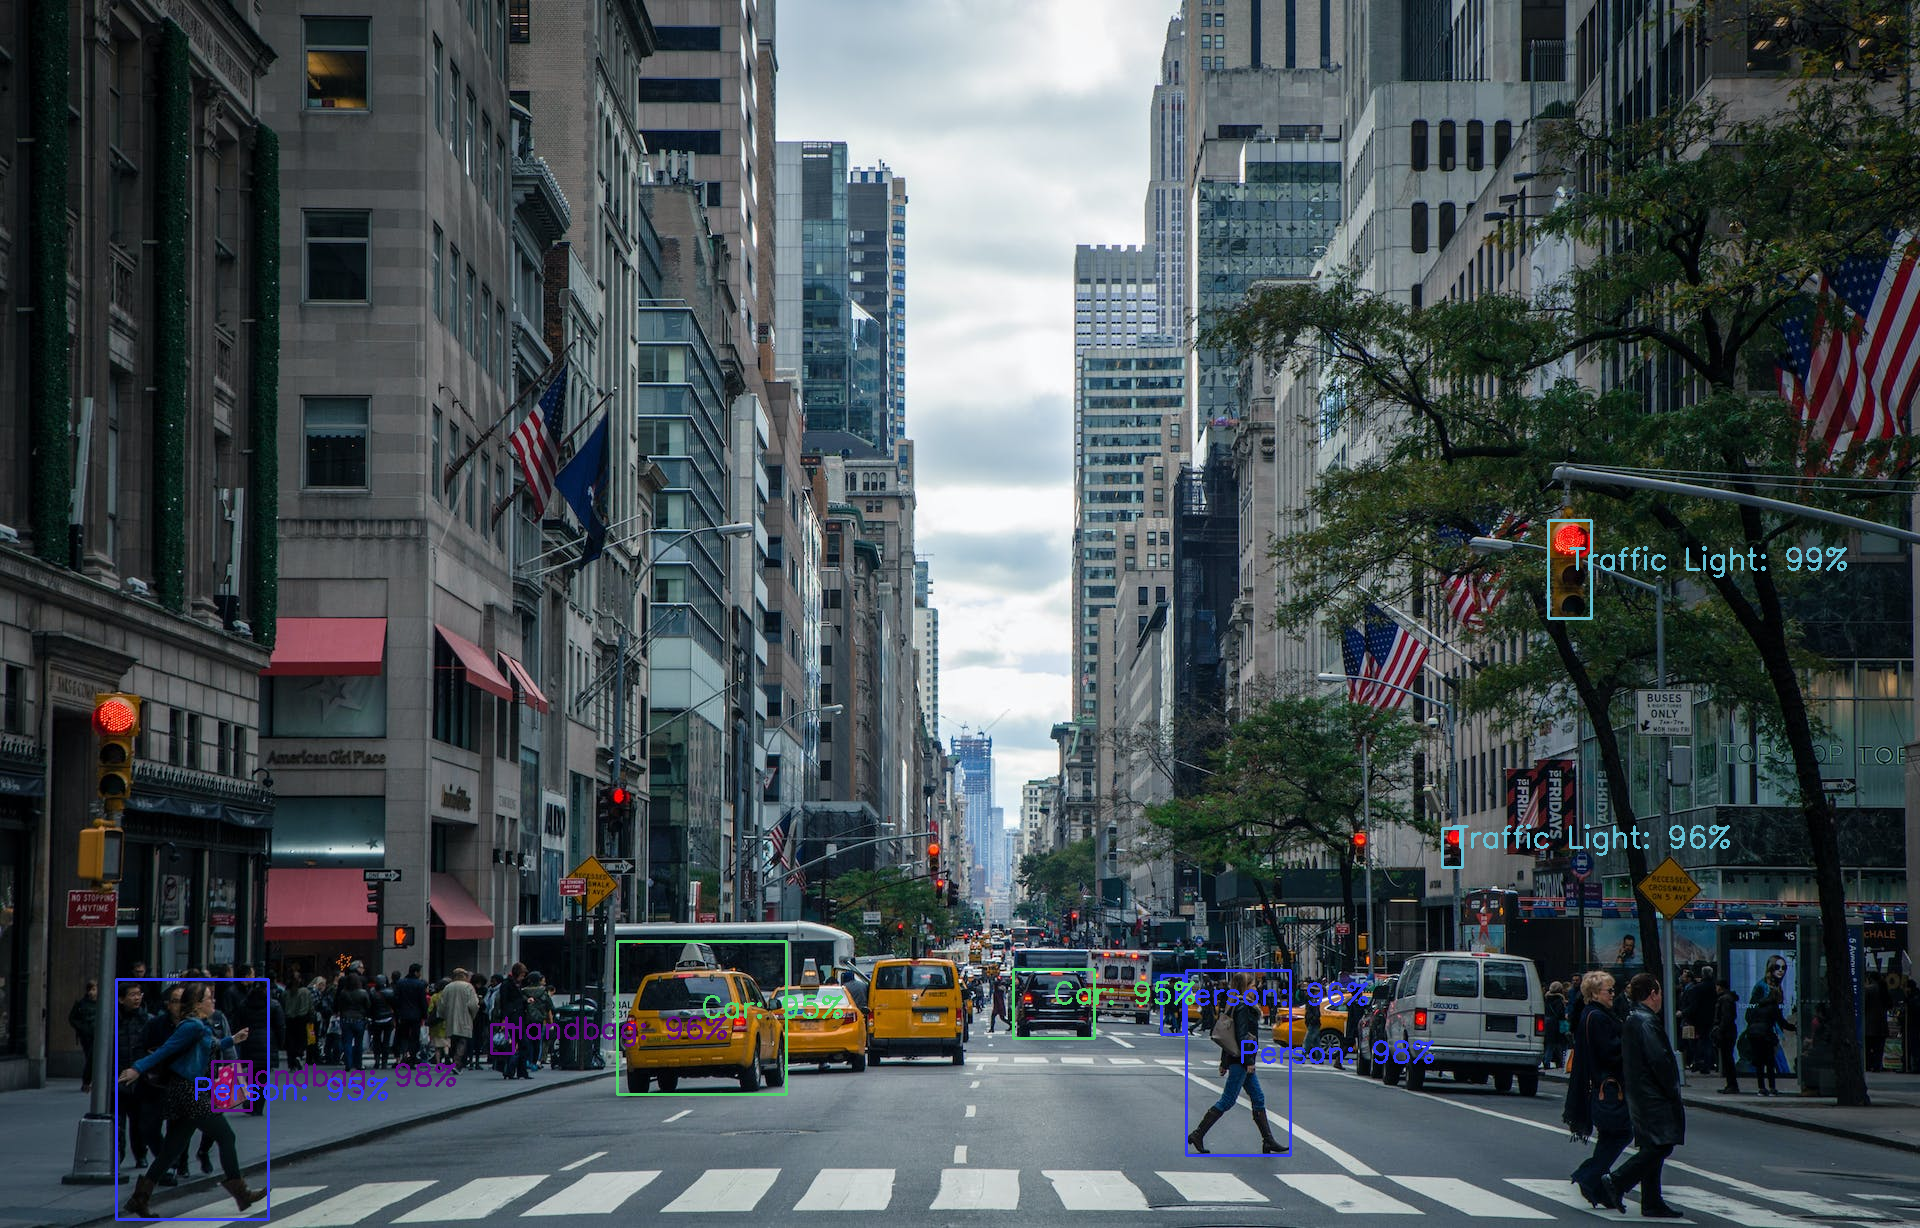
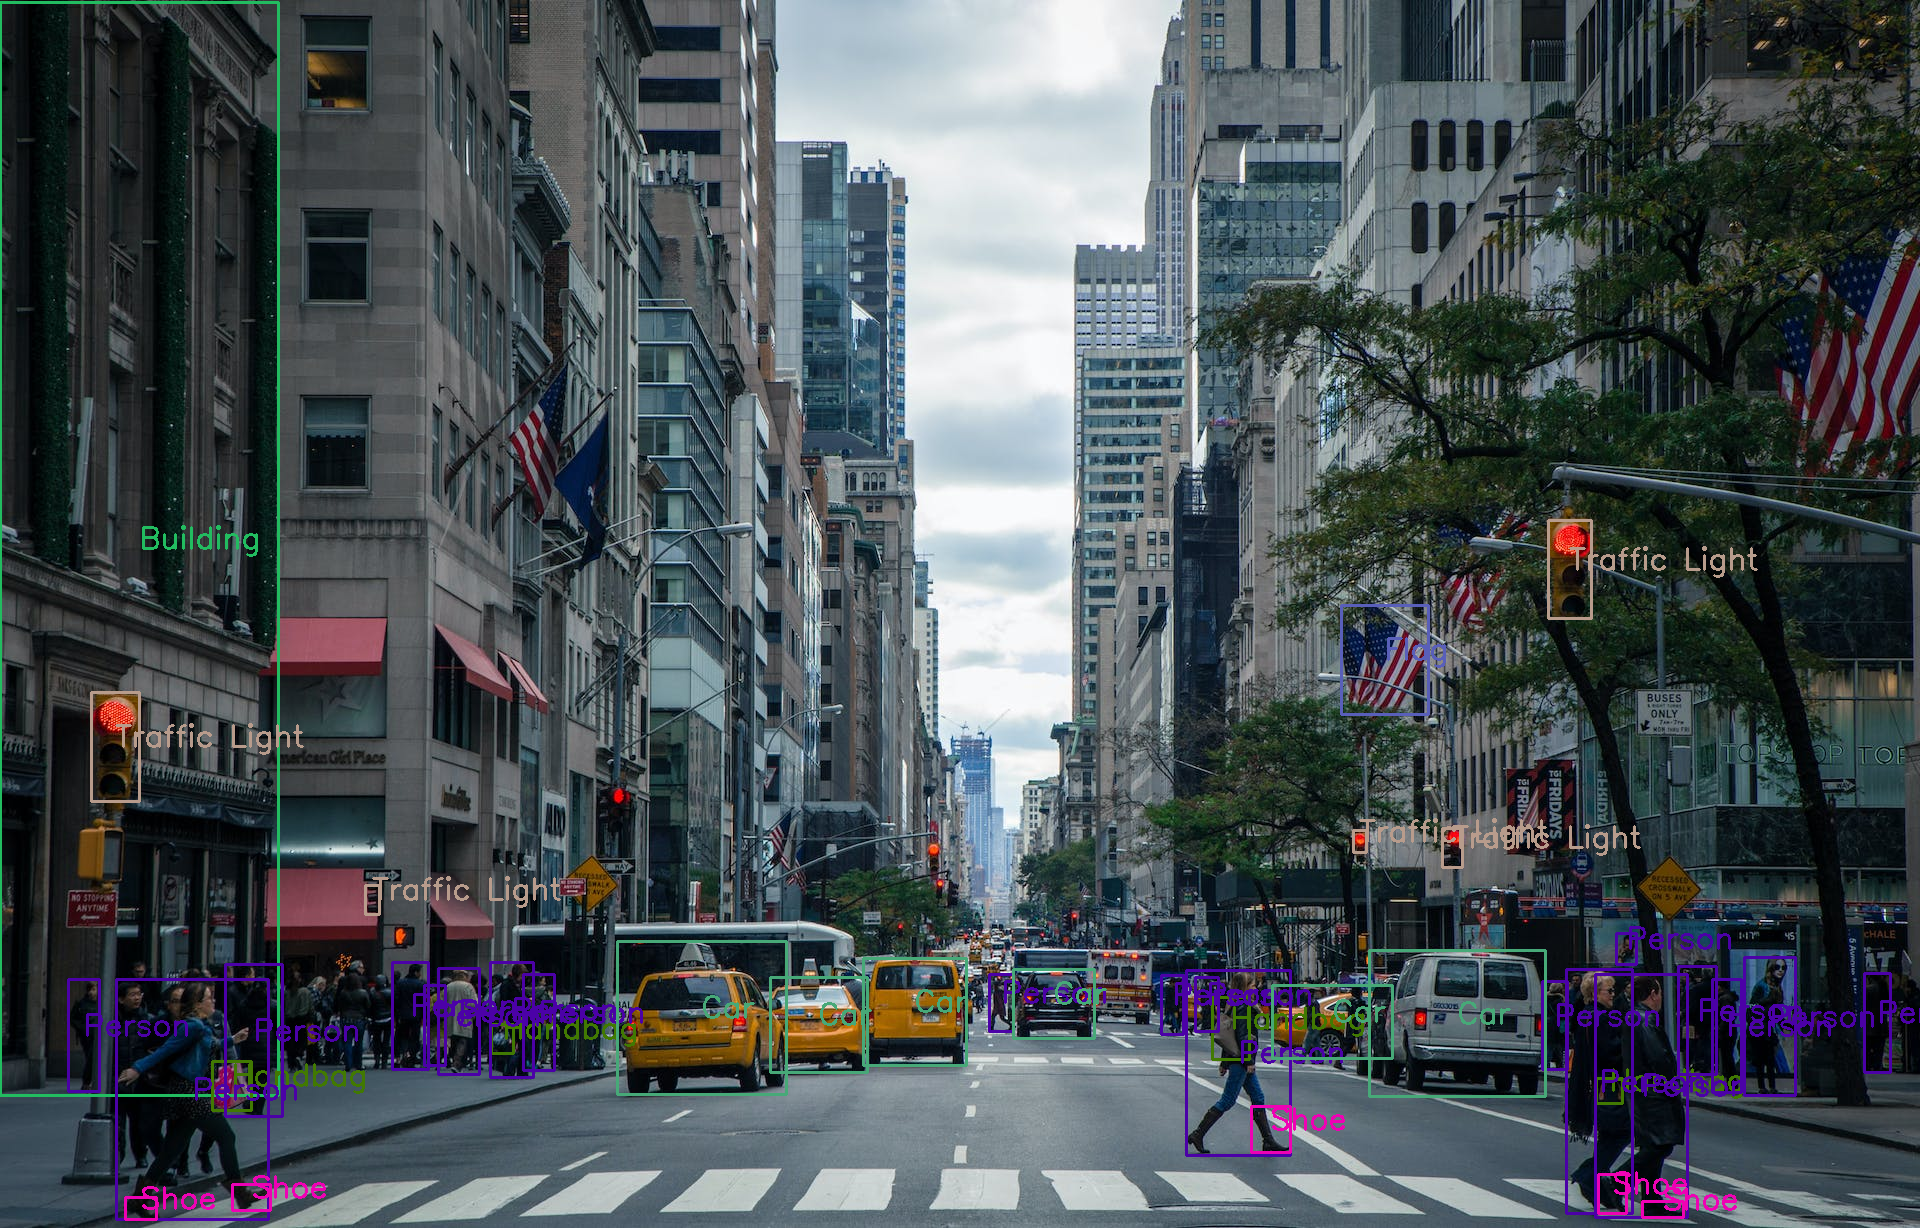
Image: probability=70%, max_labels=200
Much more objects, and detection is still pretty accurate.
Conclusions
Amazon Rekognition simplifies the integration of advanced image and video analysis capabilities into applications, empowering developers to build more intelligent and interactive solutions. Whether you’re working on security systems, content moderation, or personalized user experiences, Rekognition provides a scalable and reliable set of tools for computer vision tasks. By understanding its features, use cases, and best practices, developers can harness the power of Rekognition to enhance the functionality and user experience of their applications.
AWS Rekognition use cases, scenarios
- security and surveillance
- user authentication
- media and entertainment
- retail
- healthcare