Connecting Kinesis Firehose DataStream with aws-kinesis-agent to ingest Log Data into AWS S3

Abstract
AWS Kinesis Firehose is a powerful service that enables almost real-time data streaming at scale. It simplifies the process of ingesting, transforming, and loading large volumes of data into various AWS services. In this guide, we’ll explore what Kinesis Firehose is, its key features, and how you can leverage it for your data processing needs.
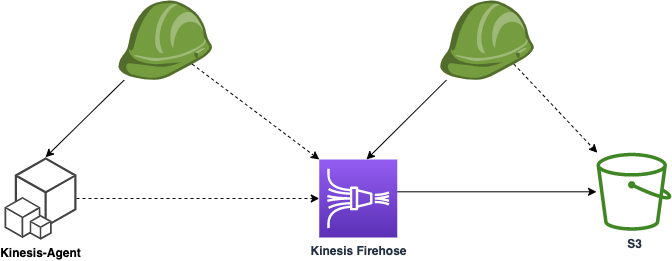
Target Infrastructure
Key Components of Kinesis Firehose
- Delivery Streams: These are the core component of Kinesis Firehose, representing the destination where data is loaded. Each delivery stream can be configured to deliver data to one or more destinations, such as Amazon S3, Amazon Redshift, Amazon Elasticsearch, or AWS Lambda.
- Data Sources: Kinesis Firehose can ingest data from a wide range of sources including web applications, IoT devices, log files, and more. It supports both HTTP and HTTPS endpoints, making it easy to integrate with various applications.
- Transformations: Firehose allows you to transform your data before it’s delivered to the destination. This can include tasks like converting data formats, compressing data, adding prefixes to object names, and more.
Integration with other Services
Firehose seamlessly integrates with other AWS services, allowing you to deliver data to services like Amazon S3, Redshift, Elasticsearch, and Lambda without the need for manual intervention. In this post we will set up S3 ingegration.
Deploying with Terraform
We are creating Target Infrastructure with IaC Terraform (Link to Terraform sample:
1
2
3
4
5
6
7
8
9
10
11
12
13
14
15
16
17
18
19
resource "aws_kinesis_firehose_delivery_stream" "extended_s3_stream" {
  name        = "terraform-kinesis-firehose-logs-s3-stream"
  destination = "extended_s3"

  extended_s3_configuration {
    role_arn           = aws_iam_role.firehose_role.arn
    bucket_arn         = aws_s3_bucket.bucket.arn
    buffering_size     = 64
    buffering_interval = 60


    dynamic_partitioning_configuration {
      enabled = "false"
    }

    prefix              = "year=!{timestamp:yyyy}/month=!{timestamp:MM}/day=!{timestamp:dd}/hour=!{timestamp:HH}/"
    error_output_prefix = "errors/year=!{timestamp:yyyy}/month=!{timestamp:MM}/day=!{timestamp:dd}/hour=!{timestamp:HH}/!{firehose:error-output-type}/"
  }
}
The critical configuration to note is the buffering settings. Kinesis Firehose initiates writes to the target system when either of two conditions is met: either the buffer size in megabytes is exceeded, or the specified time interval in seconds is reached. By making these parameters configurable, you can fine-tune the near real-time behavior and the size of ingested data chunks to suit your needs.
For current use case we will prefer faster delivery instead of sizing, just for demo effect.
Explore Created DataFirehose
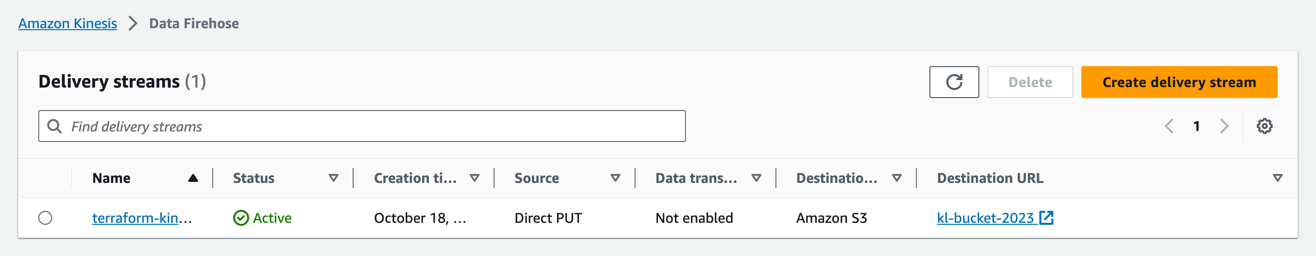
Once Terraform had applied with infrastructure resources created, we can explore other settings.
The general configuration of Firehose - direct PUTs into target S3 bucket:
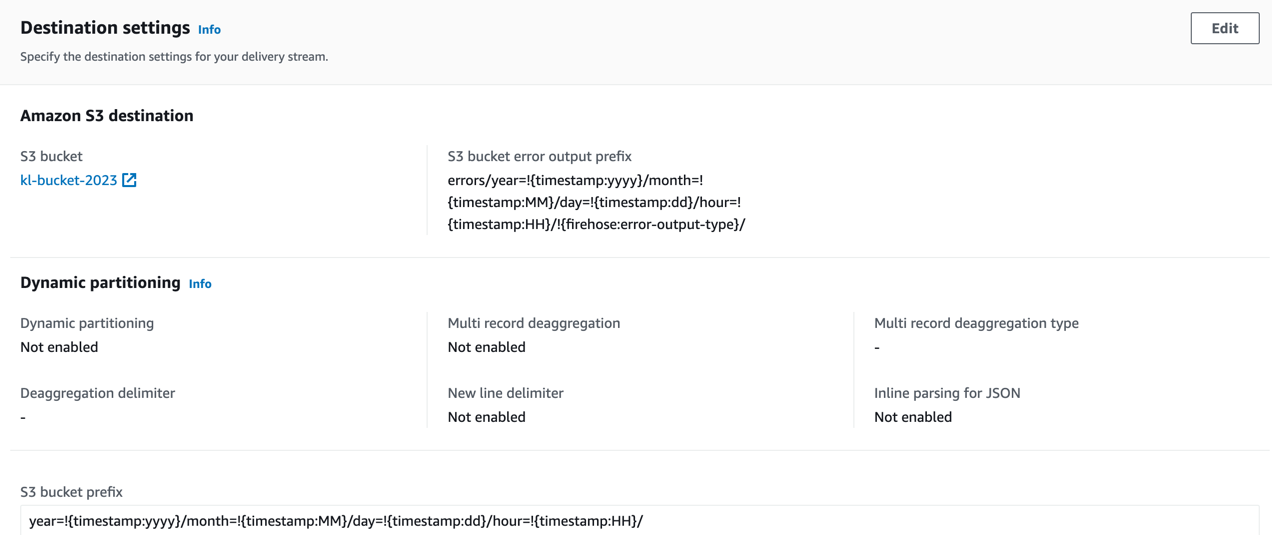
The following settings of S3 prefixes using partitionKeyFromQuery allow to distribute the data in a virtual S3 path with time-based markers.
1
2
prefix              = "year=!{timestamp:yyyy}/month=!{timestamp:MM}/day=!{timestamp:dd}/hour=!{timestamp:HH}/"
error_output_prefix = "errors/year=!{timestamp:yyyy}/month=!{timestamp:MM}/day=!{timestamp:dd}/hour=!{timestamp:HH}/!{firehose:error-output-type}/"
The prefix configuration in Kinesis Firehose allows you to specify a custom prefix that will be added to the objects before they are stored in the destination. This feature is particularly useful when you want to organize and categorize your data within the destination.
For example, if you’re storing data in Amazon S3, you can use a prefix like “year=2023/month=09/” to create a hierarchical structure where data is organized by year and month. This makes it easier to manage and query your data later on.
Additionally, prefixes can be dynamic and support the use of placeholders like {timestamp}, {firehose:random-string}, and others. This enables you to add dynamic elements to the prefix based on the content of the data.
Overall, prefix configuration in Kinesis Firehose provides a powerful way to structure and manage your data within the destination service, improving accessibility and organization.
How to query prefixed data we will see when running queries with Apache Spark from EMR cluster in the next post.
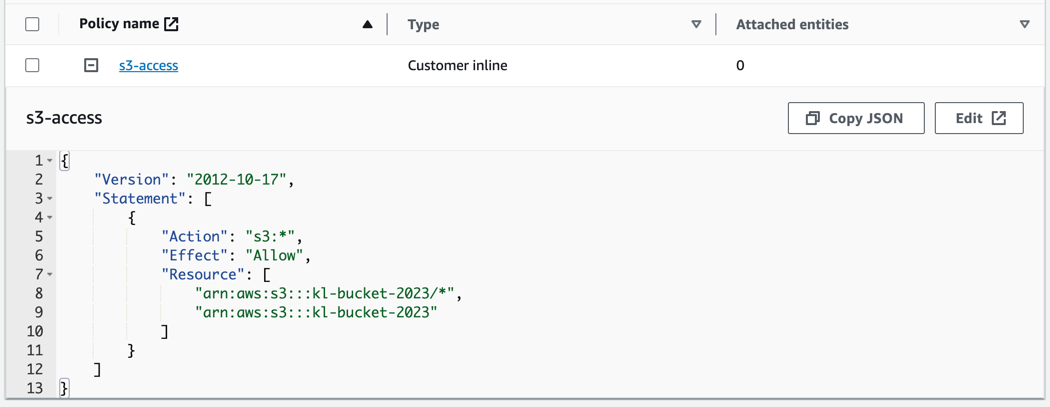
And of course important is to review the IAM role assigned to Kinesis-Firehose - the access to target S3 bucket should be allowed with write permissions.
Send Data to the Cloud
Now it’s time to send logs data from on-prem to AWS using aws-kinesis-agent, if everything is setup correctly you will see the following in logs of you agent:
1
2
3
4
2023-10-18 13:02:08.890+0000  (FileTailer[fh:terraform-kinesis-firehose-logs-s3-stream:/var/log/cadabra/*.log].MetricsEmitter RUNNING) com.amazon.kinesis.streaming.agent.tailing.FileTailer [INFO] FileTailer[fh:terraform-kinesis-firehose-logs-s3-stream:/var/log/cadabra/*.log]: Tailer Progress: Tailer has parsed 5000 records (423974 bytes), transformed 0 records, skipped 0 records, and has successfully sent 5000 records to destination.
2023-10-18 13:02:08.903+0000  (Agent.MetricsEmitter RUNNING) com.amazon.kinesis.streaming.agent.Agent [INFO] Agent: Progress: 5000 records parsed (423974 bytes), and 5000 records sent successfully to destinations. Uptime: 90219ms
2023-10-18 13:02:38.890+0000  (FileTailer[fh:terraform-kinesis-firehose-logs-s3-stream:/var/log/cadabra/*.log].MetricsEmitter RUNNING) com.amazon.kinesis.streaming.agent.tailing.FileTailer [INFO] FileTailer[fh:terraform-kinesis-firehose-logs-s3-stream:/var/log/cadabra/*.log]: Tailer Progress: Tailer has parsed 5000 records (423974 bytes), transformed 0 records, skipped 0 records, and has successfully sent 5000 records to destination.
2023-10-18 13:02:38.903+0000  (Agent.MetricsEmitter RUNNING) com.amazon.kinesis.streaming.agent.Agent [INFO] Agent: Progress: 5000 records parsed (423974 bytes), and 5000 records sent successfully to destinations. Uptime: 120219ms
Issue with kinesis agent on Ubuntu OS
If you have restarted Ubuntu machine (as I did 😀 ) kinesis-agent will fail to start again. Because, Ubuntu will drop permissions from /var/run on reboot etc. To make it work we need to update the agent configuration:
1
2
3
4
5
{
  "cloudwatch.emitMetrics": false,
  "kinesis.endpoint": "",
  "firehose.endpoint": "firehose.eu-west-1.amazonaws.com",
  "checkpointFile": "/opt/aws-kinesis-agent/run/checkpoints"
Add custom CheckPoint File here and also do not forget to update the permissions:
1
chmod ugo+rwx /opt/aws-kinesis-agent/run/chekpoints
Data available on S3
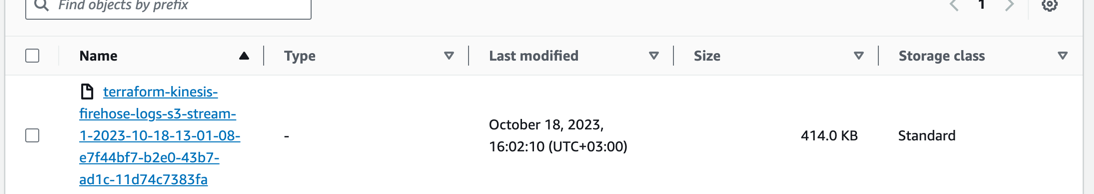
Once buffer configuration is met (by chunk size or time) we will see in S3, log files ingested from on-prem:
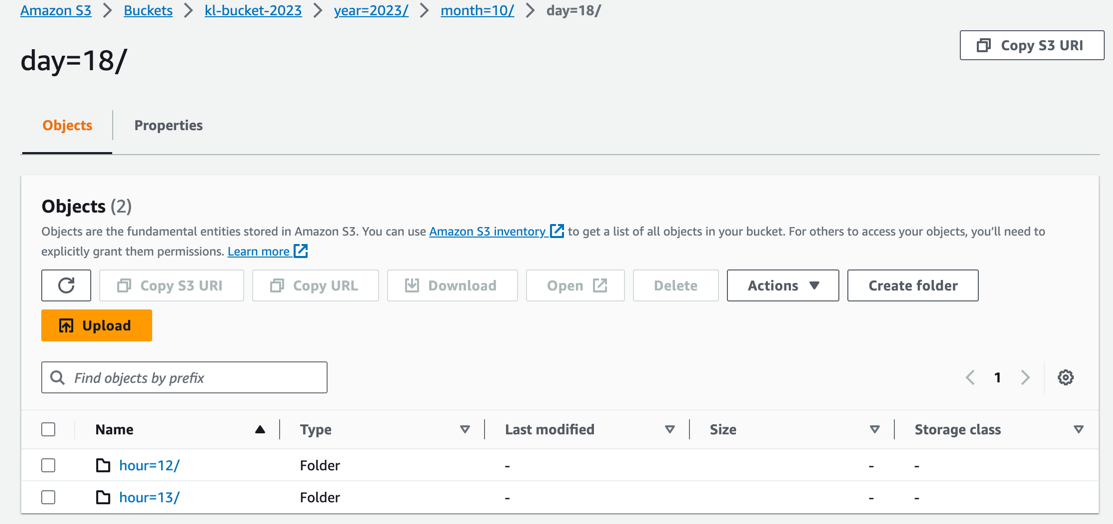
As we have configured the logs are written to virtual folder in a time manner: year/month/day/hour/
In this way Kinesis-Firehose can aggregate data in time frames, additionally perform format convertion or invoke lambda function for enrichment or data transformation (this is more advanced use cases).
Monitoring
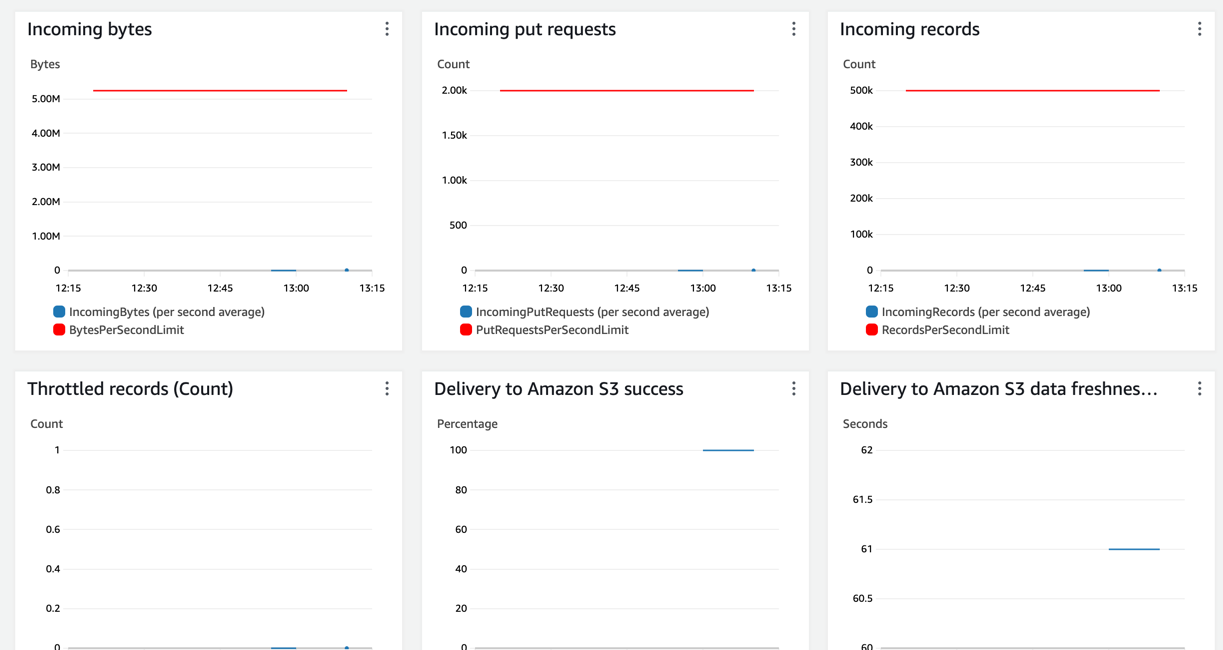
CloudWatch provides a variety of metrics related to your Kinesis Firehose delivery stream. These metrics include data delivery rates, buffer utilization, and delivery errors. By monitoring these metrics, you can gain insights into the efficiency and reliability of your data delivery process.
On monitoring tabs we can see that records are arriving and Firehose writes to S3 without any issues.
You can set up CloudWatch Alarms based on specific metrics. For example, you might set an alarm to trigger if the buffer utilization exceeds a certain threshold or if the delivery stream encounters a high rate of errors. This allows you to be proactive in addressing potential issues.
Also, Kinesis Firehose can emit log events to CloudWatch Logs. These logs provide detailed information about the activities and events related to your delivery stream. You can use these logs for troubleshooting, auditing, and performance analysis.